
Page 110 - Decision Making Applications in Modern Power Systems
P. 110
76 Decision Making Applications in Modern Power Systems
Start
MT = 2E+8; λ;
μ; N = 1000; j = 1
Yes
is j > N ?
No
CT = 0; OFF = 0; DT = 0;
U = mean (U j);
A = 1 – U;
MTTF s = mean (MTTF j);
MTTR s = mean (MTTR j);
Generate TTF hw and λ s=1/MTTF s ;
μ s= 1/MTTR s ;
TTR hw
Yes Stop
is CT > MT ? CT = 0;
No Generate TTF sw and
TTR sw
CT = CT+TTF hw +
TTR hw
OFF=OFF+1; Yes
is CT > MT ?
DT=TTR hw
No
CT = CT+TTF sw +
TTR sw
OFF=OFF+1;
DT=TTR sw Failures j = OFF;
DownTime j = DT;
U j = DT/OFF;
A j = 1 – U j;
MTTF j = (MT – DT)/OFF;
MTTR j = (DT)/OFF; j = j+1;
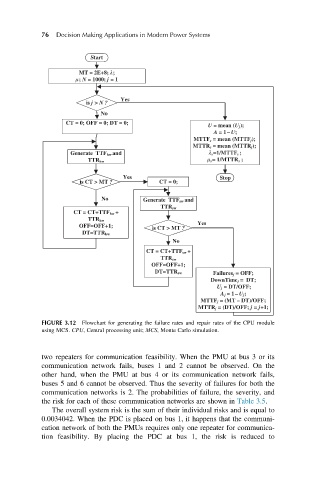
FIGURE 3.12 Flowchart for generating the failure rates and repair rates of the CPU module
using MCS. CPU, Central processing unit; MCS, Monte Carlo simulation.
two repeaters for communication feasibility. When the PMU at bus 3 or its
communication network fails, buses 1 and 2 cannot be observed. On the
other hand, when the PMU at bus 4 or its communication network fails,
buses 5 and 6 cannot be observed. Thus the severity of failures for both the
communication networks is 2. The probabilities of failure, the severity, and
the risk for each of these communication networks are shown in Table 3.5.
The overall system risk is the sum of their individual risks and is equal to
0.0034042. When the PDC is placed on bus 1, it happens that the communi-
cation network of both the PMUs requires only one repeater for communica-
tion feasibility. By placing the PDC at bus 1, the risk is reduced to