
Page 244 - Decision Making Applications in Modern Power Systems
P. 244
Effects of electrical infrastructures in grid with high penetration Chapter | 8 209
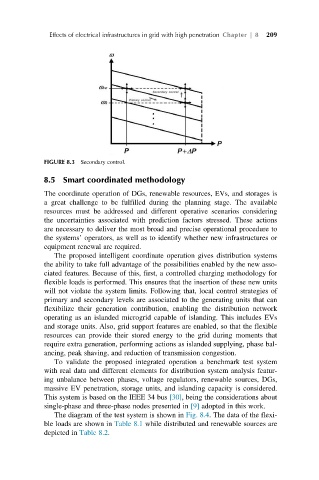
FIGURE 8.3 Secondary control.
8.5 Smart coordinated methodology
The coordinate operation of DGs, renewable resources, EVs, and storages is
a great challenge to be fulfilled during the planning stage. The available
resources must be addressed and different operative scenarios considering
the uncertainties associated with prediction factors stressed. These actions
are necessary to deliver the most broad and precise operational procedure to
the systems’ operators, as well as to identify whether new infrastructures or
equipment renewal are required.
The proposed intelligent coordinate operation gives distribution systems
the ability to take full advantage of the possibilities enabled by the new asso-
ciated features. Because of this, first, a controlled charging methodology for
flexible loads is performed. This ensures that the insertion of these new units
will not violate the system limits. Following that, local control strategies of
primary and secondary levels are associated to the generating units that can
flexibilize their generation contribution, enabling the distribution network
operating as an islanded microgrid capable of islanding. This includes EVs
and storage units. Also, grid support features are enabled, so that the flexible
resources can provide their stored energy to the grid during moments that
require extra generation, performing actions as islanded supplying, phase bal-
ancing, peak shaving, and reduction of transmission congestion.
To validate the proposed integrated operation a benchmark test system
with real data and different elements for distribution system analysis featur-
ing unbalance between phases, voltage regulators, renewable sources, DGs,
massive EV penetration, storage units, and islanding capacity is considered.
This system is based on the IEEE 34 bus [30], being the considerations about
single-phase and three-phase nodes presented in [9] adopted in this work.
The diagram of the test system is shown in Fig. 8.4. The data of the flexi-
ble loads are shown in Table 8.1 while distributed and renewable sources are
depicted in Table 8.2.