
Page 275 - Decision Making Applications in Modern Power Systems
P. 275
238 Decision Making Applications in Modern Power Systems
TABLE 9.4 The utilized wind turbine parameters.
WT parameter Value
P nom (kW) 600
ν i (m/s) 4
ν nom (m/s) 16
ν o (m/s) 20
WT, Wind turbine.
2 3 4 5 6 7 8 9 10 11 12 13
SS
1 14 15 16 17 18 19 20 21 22 23 24 25 26 27 28 29 30
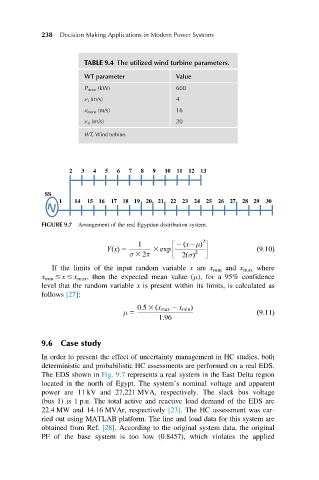
FIGURE 9.7 Arrangement of the real Egyptian distribution system.
2
1 2 ðx2μÞ
YðxÞ 5 3 exp ð9:10Þ
σ 3 2π 2ðσÞ 2
If the limits of the input random variable x are x min and x max where
x min # x # x max , then the expected mean value (μ), for a 95% confidence
level that the random variable x is present within its limits, is calculated as
follows [27]:
0:5 3 ðx max 2 x min Þ
μ 5 ð9:11Þ
1:96
9.6 Case study
In order to present the effect of uncertainty management in HC studies, both
deterministic and probabilistic HC assessments are performed on a real EDS.
The EDS shown in Fig. 9.7 represents a real system in the East Delta region
located in the north of Egypt. The system’s nominal voltage and apparent
power are 11 kV and 27,221 MVA, respectively. The slack bus voltage
(bus 1) is 1 p.u. The total active and reactive load demand of the EDS are
22.4 MW and 14.16 MVAr, respectively [23]. The HC assessment was car-
ried out using MATLAB platform. The line and load data for this system are
obtained from Ref. [28]. According to the original system data, the original
PF of the base system is too low (0.8457), which violates the applied