
Page 444 - Decision Making Applications in Modern Power Systems
P. 444
Impact of demand-side management system Chapter | 15 403
400
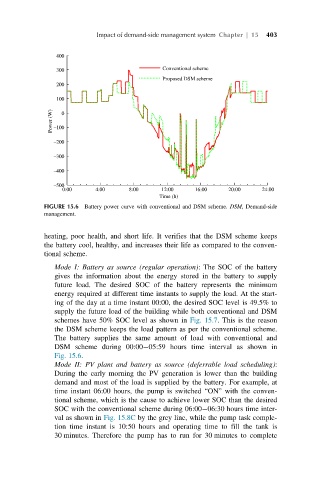
300 Conventional scheme
Proposed DSM scheme
200
100
Power (W) –100 0
–200
–300
–400
–500
0:00 4:00 8:00 12:00 16:00 20:00 24:00
Time (h)
FIGURE 15.6 Battery power curve with conventional and DSM scheme. DSM, Demand-side
management.
heating, poor health, and short life. It verifies that the DSM scheme keeps
the battery cool, healthy, and increases their life as compared to the conven-
tional scheme.
Mode I: Battery as source (regular operation): The SOC of the battery
gives the information about the energy stored in the battery to supply
future load. The desired SOC of the battery represents the minimum
energy required at different time instants to supply the load. At the start-
ing of the day at a time instant 00:00, the desired SOC level is 49.5% to
supply the future load of the building while both conventional and DSM
schemes have 50% SOC level as shown in Fig. 15.7. This is the reason
the DSM scheme keeps the load pattern as per the conventional scheme.
The battery supplies the same amount of load with conventional and
DSM scheme during 00:00 05:59 hours time interval as shown in
Fig. 15.6.
Mode II: PV plant and battery as source (deferrable load scheduling):
During the early morning the PV generation is lower than the building
demand and most of the load is supplied by the battery. For example, at
time instant 06:00 hours, the pump is switched “ON” with the conven-
tional scheme, which is the cause to achieve lower SOC than the desired
SOC with the conventional scheme during 06:00 06:30 hours time inter-
val as shown in Fig. 15.8C by the grey line, while the pump task comple-
tion time instant is 10:50 hours and operating time to fill the tank is
30 minutes. Therefore the pump has to run for 30 minutes to complete