
Page 443 - Decision Making Applications in Modern Power Systems
P. 443
402 Decision Making Applications in Modern Power Systems
15.6.1 Performance results of demand-side management scheme
with sufficient photovoltaic power
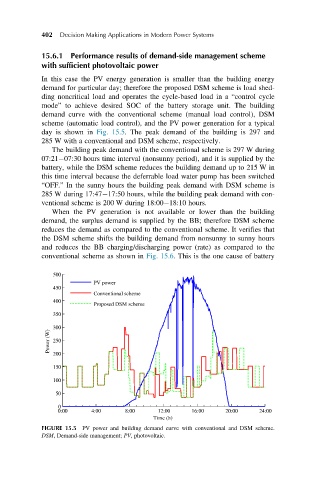
In this case the PV energy generation is smaller than the building energy
demand for particular day; therefore the proposed DSM scheme is load shed-
ding noncritical load and operates the cycle-based load in a “control cycle
mode” to achieve desired SOC of the battery storage unit. The building
demand curve with the conventional scheme (manual load control), DSM
scheme (automatic load control), and the PV power generation for a typical
day is shown in Fig. 15.5. The peak demand of the building is 297 and
285 W with a conventional and DSM scheme, respectively.
The building peak demand with the conventional scheme is 297 W during
07:21 07:30 hours time interval (nonsunny period), and it is supplied by the
battery, while the DSM scheme reduces the building demand up to 215 W in
this time interval because the deferrable load water pump has been switched
“OFF.” In the sunny hours the building peak demand with DSM scheme is
285 W during 17:47 17:50 hours, while the building peak demand with con-
ventional scheme is 200 W during 18:00 18:10 hours.
When the PV generation is not available or lower than the building
demand, the surplus demand is supplied by the BB; therefore DSM scheme
reduces the demand as compared to the conventional scheme. It verifies that
the DSM scheme shifts the building demand from nonsunny to sunny hours
and reduces the BB charging/discharging power (rate) as compared to the
conventional scheme as shown in Fig. 15.6. This is the one cause of battery
500
PV power
450
Conventional scheme
400
Proposed DSM scheme
350
300
Power (W) 250
200
150
100
50
0
0:00 4:00 8:00 12:00 16:00 20:00 24:00
Time (h)
FIGURE 15.5 PV power and building demand curve with conventional and DSM scheme.
DSM, Demand-side management; PV, photovoltaic.