Page 448 - Decision Making Applications in Modern Power Systems
P. 448

Impact of demand-side management system Chapter | 15  407


                 550
                           PV power
                 500
                           Conventional scheme
                           Proposed DSM scheme
                 450
                 400
                 350
                Power (W)  300
                 250
                 200

                 150
                 100
                 50
                  0
                  0000     0400     0800     1200     1600     2000     2400
                                            Time (h)
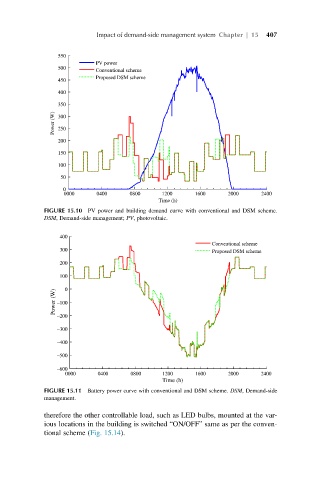
             FIGURE 15.10 PV power and building demand curve with conventional and DSM scheme.
             DSM, Demand-side management; PV, photovoltaic.


                 400
                                                          Conventional scheme
                 300                                      Proposed DSM scheme
                 200
                 100

                Power (W)  –100 0


                –200
                –300
                –400

                –500
                –600
                   0000    0400     0800     1200     1600     2000     2400
                                             Time (h)
             FIGURE 15.11 Battery power curve with conventional and DSM scheme. DSM, Demand-side
             management.

             therefore the other controllable load, such as LED bulbs, mounted at the var-
             ious locations in the building is switched “ON/OFF” same as per the conven-
             tional scheme (Fig. 15.14).
   443   444   445   446   447   448   449   450   451   452   453