Page 525 - Decision Making Applications in Modern Power Systems
P. 525
484  Decision Making Applications in Modern Power Systems


            design a reliable decision-making algorithm, total 15 features are selected
            which are very distinctive to discriminate different operating scenarios of the
            power system network such as no-fault, fault, PS, and fault during PS condi-
            tions. The distinct features that have been considered to design input datasets
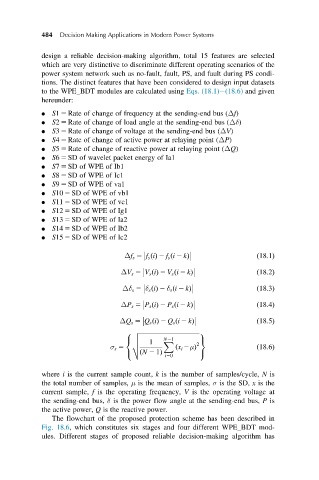
            to the WPE_BDT modules are calculated using Eqs. (18.1) (18.6) and given
            hereunder:

              S1 5 Rate of change of frequency at the sending-end bus (Δf)
              S2 5 Rate of change of load angle at the sending-end bus (Δδ)
              S3 5 Rate of change of voltage at the sending-end bus (ΔV)
              S4 5 Rate of change of active power at relaying point (ΔP)
              S5 5 Rate of change of reactive power at relaying point (ΔQ)
              S6 5 SD of wavelet packet energy of Ia1
              S7 5 SD of WPE of Ib1
              S8 5 SD of WPE of Ic1
              S9 5 SD of WPE of va1
              S10 5 SD of WPE of vb1
              S11 5 SD of WPE of vc1
              S12 5 SD of WPE of Ig1
              S13 5 SD of WPE of Ia2
              S14 5 SD of WPE of Ib2
              S15 5 SD of WPE of Ic2

                                   Δf s 5 f s iðÞ 2 f s i 2 kð  Þ     ð18:1Þ


                                  ΔV s 5 V s iðÞ 2 V s i 2 kð  Þ      ð18:2Þ


                                  Δδ s 5 δ s iðÞ 2 δ s i 2 kð  Þ      ð18:3Þ


                                  ΔP s 5 P s iðÞ 2 P s i 2 kð  Þ      ð18:4Þ


                                 ΔQ s 5 Q s iðÞ 2 Q s i 2 kð  Þ       ð18:5Þ

                                   8 v ffiffiffiffiffiffiffiffiffiffiffiffiffiffiffiffiffiffiffiffiffiffiffiffiffiffiffiffiffiffiffiffiffiffiffiffiffiffiffi9
                                     u       N21
                                   <                   =
                                     u   1   X        2
                               σ s 5  t         ð x i 2μÞ             ð18:6Þ
                                       ð N 2 1Þ
                                              i50
                                   :                   ;
            where i is the current sample count, k is the number of samples/cycle, N is
            the total number of samples, μ is the mean of samples, σ is the SD, x is the
            current sample, f is the operating frequency, V is the operating voltage at
            the sending-end bus, δ is the power flow angle at the sending-end bus, P is
            the active power, Q is the reactive power.
               The flowchart of the proposed protection scheme has been described in
            Fig. 18.6, which constitutes six stages and four different WPE_BDT mod-
            ules. Different stages of proposed reliable decision-making algorithm has

