Page 84 - Decision Making Applications in Modern Power Systems
P. 84

54  Decision Making Applications in Modern Power Systems


               2200
              Forecasted load profile (kW)  1800
               2000


               1600

               1400
               1200
                    1  2  3  4  5  6  7  8  9 10 11 12 13 14 15 16 17 18 19 20 21 22 23 24
                                             Time (h)
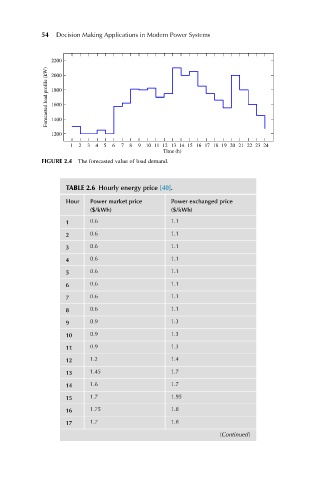
            FIGURE 2.4 The forecasted value of load demand.


                   TABLE 2.6 Hourly energy price [40].

                   Hour  Power market price    Power exchanged price
                         ($/kWh)               ($/kWh)
                   1     0.6                   1.1
                   2     0.6                   1.1
                   3     0.6                   1.1

                   4     0.6                   1.1
                   5     0.6                   1.1
                   6     0.6                   1.1
                   7     0.6                   1.1
                   8     0.6                   1.1
                   9     0.9                   1.3
                   10    0.9                   1.3
                   11    0.9                   1.3
                   12    1.2                   1.4
                   13    1.45                  1.7

                   14    1.6                   1.7
                   15    1.7                   1.95
                   16    1.75                  1.8
                   17    1.7                   1.8
                                                            (Continued)
   79   80   81   82   83   84   85   86   87   88   89