
Page 85 - Decision Making Applications in Modern Power Systems
P. 85
Uncertainty management in decision-making Chapter | 2 55
TABLE 2.6 (Continued)
Hour Power market price Power exchanged price
($/kWh) ($/kWh)
18 1.4 1.6
19 1 1.3
20 0.8 1.3
21 0.8 1.25
22 0.8 1.3
23 0.7 1.2
24 0.6 1.1
9000
8500
8000
7500
7000
Profit ($) 6500
6000
5500
5000
4500
0
1 2 3 4 5 6 7 8 9 10
Scenario
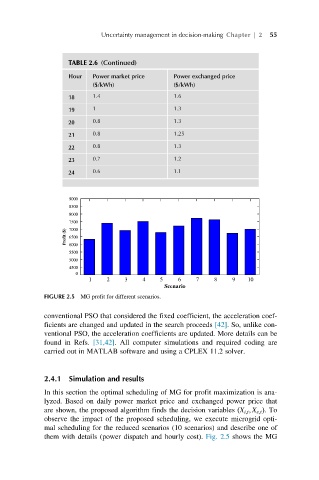
FIGURE 2.5 MG profit for different scenarios.
conventional PSO that considered the fixed coefficient, the acceleration coef-
ficients are changed and updated in the search proceeds [42]. So, unlike con-
ventional PSO, the acceleration coefficients are updated. More details can be
found in Refs. [31,42]. All computer simulations and required coding are
carried out in MATLAB software and using a CPLEX 11.2 solver.
2.4.1 Simulation and results
In this section the optimal scheduling of MG for profit maximization is ana-
lyzed. Based on daily power market price and exchanged power price that
are shown, the proposed algorithm finds the decision variables ðX i;t ; X e;t Þ.To
observe the impact of the proposed scheduling, we execute microgrid opti-
mal scheduling for the reduced scenarios (10 scenarios) and describe one of
them with details (power dispatch and hourly cost). Fig. 2.5 shows the MG