
Page 89 - Decision Making Applications in Modern Power Systems
P. 89
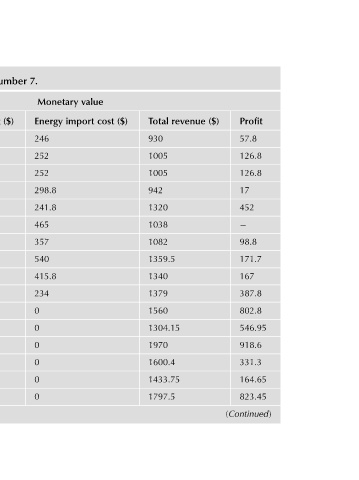
Profit  57.8  126.8  126.8  17  452     98.8  171.7  167  387.8  802.8  546.95  918.6  331.3  164.65  823.45  (Continued)


                       ($)
                       revenue


                       Total  930  1005  1005  942  1320  1038  1082  1359.5  1340  1379  1560  1304.15  1970  1600.4  1433.75  1797.5


                       ($)
                       cost
                    value  import

                    Monetary  Energy


                7.        246  252  252  298.8  241.8  465  357  540  415.8  234  0  0  0  0  0  0
                number  ($)  cost


                scenario  mission


                for    E  79.2  79.2  79.2  79.2  79.2  79.2  79.2  100.8  115.2  115.2  115.2  115.2  194.4  219.6  219.6  190.8
                value  ($)

                monetary  cost  Gen  547  547  547  547  547  547  547  547  642  642  642  642  857  1049.5  1049.5  783.25


                and    G3  250  250  250  250  250  250  250  250  300  300  300  300  300  300  300  300
                schedule  (kW) dispatch


                Dispatch  Power  G2  0  0  0  0  0  0  0  0  0  0  0  0  100  150  150  75


                2.8    G1  300  300  300  300  300  300  300  300  300  300  300  300  300  300  300  300
                TABLE  Hour  1  2  3  4  5  6  7  8  9  10  11  12  13  14  15  16