
Page 195 - Design and Operation of Heat Exchangers and their Networks
P. 195
Thermal design of evaporators and condensers 183
R600a, R290, and R1270. The deviations are 14.8% for Nusselt equation
(4.217) and 21.0% for Akers model (4.218). The pressure drop differs a little
from his earlier work:
KE=V
Δp f
¼ 1:90 (4.221)
1 kPa 1J=m 3
It should be mentioned that in his correlation, a mean vapor mass fraction
between the inlet and outlet was used with _x in ¼ 0:95 1:0 and
_ x out ¼ 0:0 0:06.
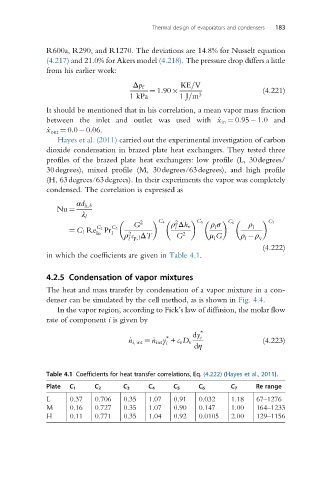
Hayes et al. (2011) carried out the experimental investigation of carbon
dioxide condensation in brazed plate heat exchangers. They tested three
profiles of the brazed plate heat exchangers: low profile (L, 30degrees/
30degrees), mixed profile (M, 30degrees/63degrees), and high profile
(H, 63degrees/63degrees). In their experiments the vapor was completely
condensed. The correlation is expressed as
αd h,b
Nu ¼
λ l
2 2 C 7
C 4
C 5
C 6
G ρ Δh v ρ σ ρ l
l
C 2
¼ C 1 Re Pr C 3 l
lo l 2 2
ρ c p,l ΔT G μ G ρ ρ v
l
l
l
(4.222)
in which the coefficients are given in Table 4.1.
4.2.5 Condensation of vapor mixtures
The heat and mass transfer by condensation of a vapor mixture in a con-
denser can be simulated by the cell method, as is shown in Fig. 4.4.
In the vapor region, according to Fick’s law of diffusion, the molar flow
rate of component i is given by
∗ dy ∗ i
_ n i, int ¼ _n int y + c v D v dη (4.223)
i
Table 4.1 Coefficients for heat transfer correlations, Eq. (4.222) (Hayes et al., 2011).
Plate C 1 C 2 C 3 C 4 C 5 C 6 C 7 Re range
L 0.37 0.706 0.35 1.07 0.91 0.032 1.18 67–1276
M 0.16 0.727 0.35 1.07 0.90 0.147 1.00 164–1233
H 0.11 0.771 0.35 1.04 0.92 0.0105 2.00 129–1156