
Page 299 - Design for Environment A Guide to Sustainable Product Development
P. 299
Medical and Pharmaceutical Industries 275
cardiovascular/critical care. In 1923 Lilly introduced the first commer-
cial insulin product. With nearly $19 billion in sales in 2007, Lilly has
about 40,000 employees providing products in over 143 countries.
Lilly is committed to continuously improving the environmental
aspects of its operations, including employee health and safety, envi-
ronmental protection, and the efficiency of energy and materials use.
During the five-year period from 2003 to 2007, Lilly
• Cut hazardous materials purchases in half
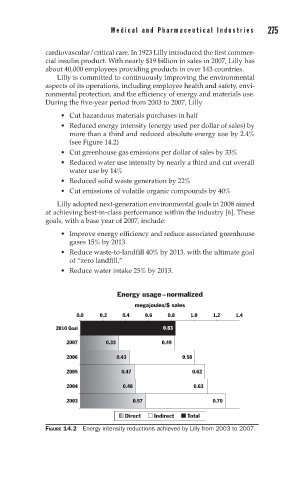
• Reduced energy intensity (energy used per dollar of sales) by
more than a third and reduced absolute energy use by 2.4%
(see Figure 14.2)
• Cut greenhouse gas emissions per dollar of sales by 33%
• Reduced water use intensity by nearly a third and cut overall
water use by 14%
• Reduced solid waste generation by 22%
• Cut emissions of volatile organic compounds by 40%
Lilly adopted next-generation environmental goals in 2008 aimed
at achieving best-in-class performance within the industry [6]. These
goals, with a base year of 2007, include:
• Improve energy efficiency and reduce associated greenhouse
gases 15% by 2013.
• Reduce waste-to-landfill 40% by 2013, with the ultimate goal
of “zero landfill.”
• Reduce water intake 25% by 2013.
Energy usage – normalized
megajoules/$ sales
0.0 0.2 0.4 0.6 0.8 1.0 1.2 1.4
2010 Goal 0.83
2007 0.33 0.49
2006 0.43 0.58
2005 0.47 0.62
2004 0.48 0.63
2003 0.57 0.70
Direct Indirect Total
FIGURE 14.2 Energy intensity reductions achieved by Lilly from 2003 to 2007.