
Page 306 - Design for Environment A Guide to Sustainable Product Development
P. 306
282 Cha pte r F i f tee n
In early 2007, the U.S. Grocery Manufacturers Association held its
first-ever Environmental Sustainability Summit for the Food, Bever-
age, and Consumer Products Industry. The conference showcased the
fast-growing efforts of leading food, beverage, and consumer prod-
ucts companies to contribute to environmental sustainability, and
explored available tools for designing sustainable products and pack-
aging, including product life-cycle assessment and carbon footprint-
ing. Much of the credit for this surge of interest goes to Wal-Mart,
which has made clear to all of its suppliers that their products and
packaging will be evaluated in terms of environmental performance
(see Chapter 19). Examples of progressive industry practices include
the following:
• Anheuser-Busch has been recycling leftover grain from the
brewing process for over 100 years and harnessing renew-
able energy from the nutrient-rich brewery wastewater for
more than two decades. The company has reduced packag-
ing weight and recycles 99% of the solid waste that it gener-
ates—over 5 billion pounds of materials per year. From 2003
to 2007, it reduced water consumption per production unit by
more than 7% and fuel consumption per production unit
by more than 15%.
• Kraft Foods, one of the world’s largest food and beverage
companies, has implemented an energy management pro-
gram based on conservation, operating efficiency, and alter-
native technologies, including conversion of waste biomass,
such as whey and meat, to energy. The company was able to
decrease absolute energy use by 14% from 2001 to 2006,
while production increased by about 10% during that period.
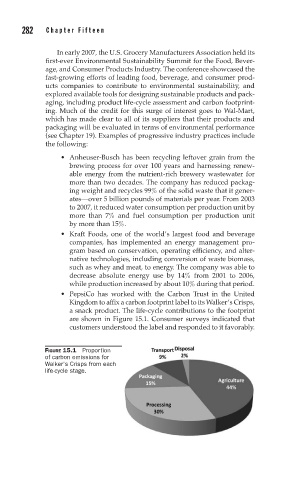
• PepsiCo has worked with the Carbon Trust in the United
Kingdom to affix a carbon footprint label to its Walker’s Crisps,
a snack product. The life-cycle contributions to the footprint
are shown in Figure 15.1. Consumer surveys indicated that
customers understood the label and re sponded to it favorably.
FIGURE 15.1 Proportion
of carbon emissions for
Walker's Crisps from each
life-cycle stage.