
Page 415 - Design for Six Sigma a Roadmap for Product Development
P. 415
382 Chapter Ten
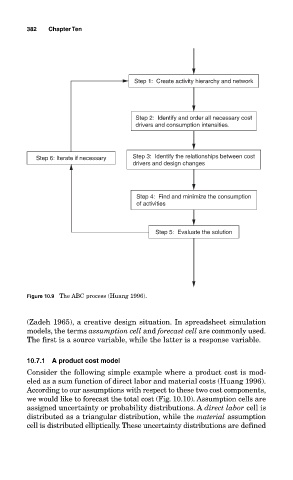
Step 1: Create activity hierarchy and network
Step 2: Identify and order all necessary cost
drivers and consumption intensities.
Step 6: Iterate if necessary Step 3: Identify the relationships between cost
drivers and design changes
Step 4: Find and minimize the consumption
of activities
Step 5: Evaluate the solution
Figure 10.9 The ABC process (Huang 1996).
(Zadeh 1965), a creative design situation. In spreadsheet simulation
models, the terms assumption cell and forecast cell are commonly used.
The first is a source variable, while the latter is a response variable.
10.7.1 A product cost model
Consider the following simple example where a product cost is mod-
eled as a sum function of direct labor and material costs (Huang 1996).
According to our assumptions with respect to these two cost components,
we would like to forecast the total cost (Fig. 10.10). Assumption cells are
assigned uncertainty or probability distributions. A direct labor cell is
distributed as a triangular distribution, while the material assumption
cell is distributed elliptically. These uncertainty distributions are defined