
Page 53 - Design for Six Sigma a Roadmap for Product Development
P. 53
Six Sigma and Lean Fundamentals 31
on the midpoint between the specification limits). We say that this is
about 64 ppm nonconforming. In this case, we would be looking at nor-
mal curve areas beyond 1.33
3 4 from the center.
When C p 1.67 (5 level), approximately 0.000057 percent of the
parts are outside the specification limits (assuming that the process is
centered on the midpoint between the specification limits). We say that
this is about 0.6 ppm nonconforming. In this case, we would be looking
at normal curve areas beyond 1.67
3 5 from the center of the
normal distribution.
The capability index C pk . The major weakness in C p is that, for many
processes, the processes mean performance is not equal to the center
of the specification limit; also many process means will drift from time
to time. When that happens, the probability calculation about noncon-
formance will be totally wrong when we still use C p . Therefore, one
must consider where the process mean is located relative to the speci-
fication limits. The index C pk is created to do exactly this.
USL LSL
C pk min and
3
3
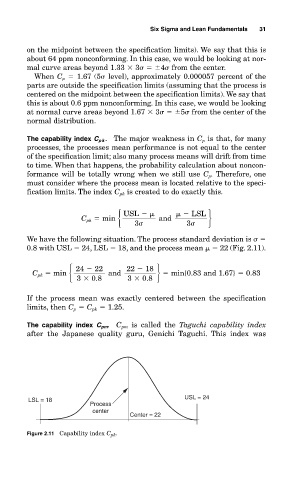
We have the following situation. The process standard deviation is
0.8 with USL 24, LSL 18, and the process mean 22 (Fig. 2.11).
24 22 22 18
C pk min and min{0.83 and 1.67} 0.83
3
0.8
3
0.8
If the process mean was exactly centered between the specification
limits, then C p C pk 1.25.
The capability index C pm . C pm is called the Taguchi capability index
after the Japanese quality guru, Genichi Taguchi. This index was
USL = 24
LSL = 18
Process
center
Center = 22
Figure 2.11 Capability index C pk .