
Page 52 - Design for Six Sigma a Roadmap for Product Development
P. 52
30 Chapter Two
USL
LSL
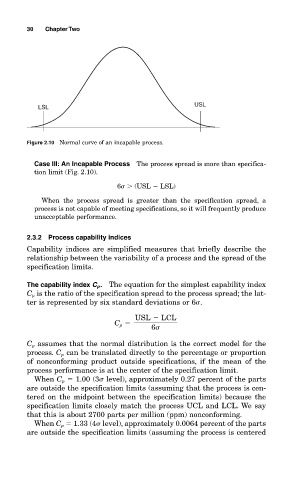
Figure 2.10 Normal curve of an incapable process.
Case III: An Incapable Process The process spread is more than specifica-
tion limit (Fig. 2.10).
6 (USL LSL)
When the process spread is greater than the specification spread, a
process is not capable of meeting specifications, so it will frequently produce
unacceptable performance.
2.3.2 Process capability indices
Capability indices are simplified measures that briefly describe the
relationship between the variability of a process and the spread of the
specification limits.
The capability index C p . The equation for the simplest capability index
C p is the ratio of the specification spread to the process spread; the lat-
ter is represented by six standard deviations or 6 .
USL LCL
C p
6
C p assumes that the normal distribution is the correct model for the
process. C p can be translated directly to the percentage or proportion
of nonconforming product outside specifications, if the mean of the
process performance is at the center of the specification limit.
When C p 1.00 (3 level), approximately 0.27 percent of the parts
are outside the specification limits (assuming that the process is cen-
tered on the midpoint between the specification limits) because the
specification limits closely match the process UCL and LCL. We say
that this is about 2700 parts per million (ppm) nonconforming.
When C p 1.33 (4 level), approximately 0.0064 percent of the parts
are outside the specification limits (assuming the process is centered