
Page 51 - Design for Six Sigma a Roadmap for Product Development
P. 51
Six Sigma and Lean Fundamentals 29
USL
LSL
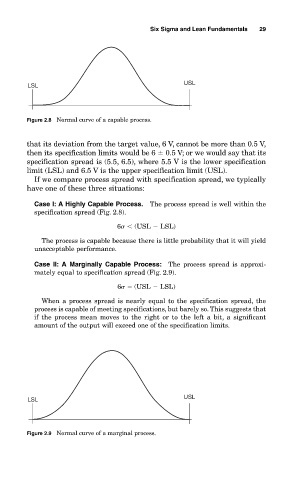
Figure 2.8 Normal curve of a capable process.
that its deviation from the target value, 6 V, cannot be more than 0.5 V,
then its specification limits would be 6 0.5 V; or we would say that its
specification spread is (5.5, 6.5), where 5.5 V is the lower specification
limit (LSL) and 6.5 V is the upper specification limit (USL).
If we compare process spread with specification spread, we typically
have one of these three situations:
Case I: A Highly Capable Process. The process spread is well within the
specification spread (Fig. 2.8).
6 (USL LSL)
The process is capable because there is little probability that it will yield
unacceptable performance.
Case II: A Marginally Capable Process: The process spread is approxi-
mately equal to specification spread (Fig. 2.9).
6 (USL LSL)
When a process spread is nearly equal to the specification spread, the
process is capable of meeting specifications, but barely so. This suggests that
if the process mean moves to the right or to the left a bit, a significant
amount of the output will exceed one of the specification limits.
USL
LSL
Figure 2.9 Normal curve of a marginal process.