
Page 542 - Design for Six Sigma a Roadmap for Product Development
P. 542
Design Optimization:Taguchi’s Robust Parameter Design 501
where L quality loss
k quality loss coefficient
E expected value
T target value of Y
The objective of the robust design is to minimize the loss function L.
Taguchi concluded that any deviation of performance y from its target
value will incur a quality loss.
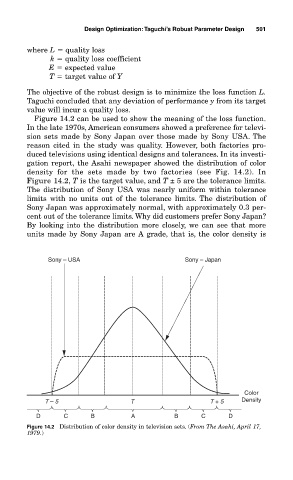
Figure 14.2 can be used to show the meaning of the loss function.
In the late 1970s, American consumers showed a preference for televi-
sion sets made by Sony Japan over those made by Sony USA. The
reason cited in the study was quality. However, both factories pro-
duced televisions using identical designs and tolerances. In its investi-
gation report, the Asahi newspaper showed the distribution of color
density for the sets made by two factories (see Fig. 14.2). In
Figure 14.2, T is the target value, and T ± 5 are the tolerance limits.
The distribution of Sony USA was nearly uniform within tolerance
limits with no units out of the tolerance limits. The distribution of
Sony Japan was approximately normal, with approximately 0.3 per-
cent out of the tolerance limits. Why did customers prefer Sony Japan?
By looking into the distribution more closely, we can see that more
units made by Sony Japan are A grade, that is, the color density is
Sony – USA Sony – Japan
Color
T – 5 T T + 5 Density
D C B A B C D
Figure 14.2 Distribution of color density in television sets. (From The Asahi, April 17,
1979.)