
Page 543 - Design for Six Sigma a Roadmap for Product Development
P. 543
502 Chapter Fourteen
Quality Loss
A 0
T
T – 0 T + 0
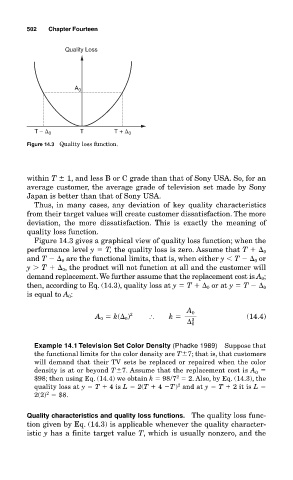
Figure 14.3 Quality loss function.
within T 1, and less B or C grade than that of Sony USA. So, for an
average customer, the average grade of television set made by Sony
Japan is better than that of Sony USA.
Thus, in many cases, any deviation of key quality characteristics
from their target values will create customer dissatisfaction. The more
deviation, the more dissatisfaction. This is exactly the meaning of
quality loss function.
Figure 14.3 gives a graphical view of quality loss function; when the
performance level y T, the quality loss is zero. Assume that T 0
and T 0 are the functional limits, that is, when either y T 0 or
y T 0 , the product will not function at all and the customer will
demand replacement.We further assume that the replacement cost is A 0 ;
then, according to Eq. (14.3), quality loss at y T 0 or at y T 0
is equal to A 0 :
A 0
A 0 k( 0 ) 2 k (14.4)
2
0
Example 14.1 Television Set Color Density (Phadke 1989) Suppose that
the functional limits for the color density are T 7; that is, that customers
will demand that their TV sets be replaced or repaired when the color
density is at or beyond T 7. Assume that the replacement cost is A 0
2
$98; then using Eq. (14.4) we obtain k 98/7 2. Also, by Eq. (14.3), the
2
quality loss at y T 4 is L 2(T 4 T) and at y T 2 it is L
2
2(2) $8.
Quality characteristics and quality loss functions. The quality loss func-
tion given by Eq. (14.3) is applicable whenever the quality character-
istic y has a finite target value T, which is usually nonzero, and the