
Page 76 - Design for Six Sigma a Roadmap for Product Development
P. 76
52 Chapter Two
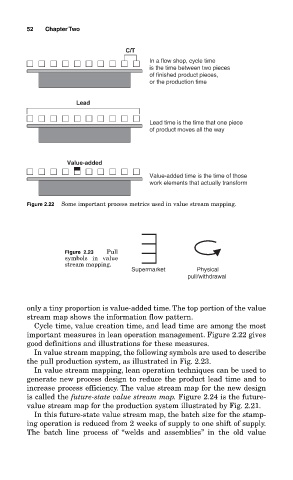
C/T
In a flow shop, cycle time
is the time between two pieces
of finished product pieces,
or the production time
Lead
Lead time is the time that one piece
of product moves all the way
Value-added
Value-added time is the time of those
work elements that actually transform
Figure 2.22 Some important process metrics used in value stream mapping.
Figure 2.23 Pull
symbols in value
stream mapping.
Supermarket Physical
pull/withdrawal
only a tiny proportion is value-added time. The top portion of the value
stream map shows the information flow pattern.
Cycle time, value creation time, and lead time are among the most
important measures in lean operation management. Figure 2.22 gives
good definitions and illustrations for these measures.
In value stream mapping, the following symbols are used to describe
the pull production system, as illustrated in Fig. 2.23.
In value stream mapping, lean operation techniques can be used to
generate new process design to reduce the product lead time and to
increase process efficiency. The value stream map for the new design
is called the future-state value stream map. Figure 2.24 is the future-
value stream map for the production system illustrated by Fig. 2.21.
In this future-state value stream map, the batch size for the stamp-
ing operation is reduced from 2 weeks of supply to one shift of supply.
The batch line process of “welds and assemblies” in the old value