
Page 73 - Design for Six Sigma a Roadmap for Product Development
P. 73
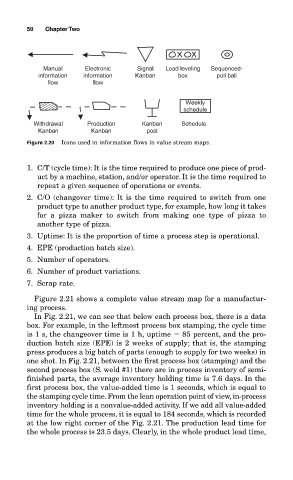
50   Chapter Two


                Manual     Electronic    Signal  Load leveling  Sequenced-
               information  information  Kanban     box        pull ball
                 flow        flow


                                                      Weekly
                                                      schedule
             Withdrawal     Production     Kanban    Schedule
              Kanban         Kanban         post
           Figure 2.20  Icons used in information flows in value stream maps.


           1. C/T (cycle time): It is the time required to produce one piece of prod-
              uct by a machine, station, and/or operator. It is the time required to
              repeat a given sequence of operations or events.
           2. C/O (changover time): It is the time required to switch from one
              product type to another product type, for example, how long it takes
              for a pizza maker to switch from making one type of pizza to
              another type of pizza.
           3. Uptime: It is the proportion of time a process step is operational.
           4. EPE (production batch size).
           5. Number of operators.
           6. Number of product variations.
           7. Scrap rate.

             Figure 2.21 shows a complete value stream map for a manufactur-
           ing process.
             In Fig. 2.21, we can see that below each process box, there is a data
           box. For example, in the leftmost process box stamping, the cycle time
           is 1 s, the changeover time is 1 h, uptime   85 percent, and the pro-
           duction batch size (EPE) is 2 weeks of supply; that is, the stamping
           press produces a big batch of parts (enough to supply for two weeks) in
           one shot. In Fig. 2.21, between the first process box (stamping) and the
           second process box (S. weld #1) there are in process inventory of semi-
           finished parts, the average inventory holding time is 7.6 days. In the
           first process box, the value-added time is 1 seconds, which is equal to
           the stamping cycle time. From the lean operation point of view, in-process
           inventory holding is a nonvalue-added activity. If we add all value-added
           time for the whole process, it is equal to 184 seconds, which is recorded
           at the low right corner of the Fig. 2.21. The production lead time for
           the whole process is 23.5 days. Clearly, in the whole product lead time,