
Page 69 - Design for Six Sigma a Roadmap for Product Development
P. 69
46 Chapter Two
by simply trying to define and map the process, we provide a means
for both understanding and communicating operational details to
those involved in the process. We also provide a baseline, or stan-
dard, for evaluating the improvement. In many cases, merely defin-
ing and charting the process as it is can reveal many deficiencies
such as redundant and needless steps and other nonvalue-added
activities.
A process flowchart is a common graphic way of illustrating a group
of activities in a process. The basic purpose of these flowcharts is to
provide a graphical representation of all the activities performed in
the sequence in which they are actually conducted. The advantages of
graphical flowchart include easiness to visualize and understand the
activities in the process and their relationships.
Flowcharts use symbols connected by arrows to describe
processes. The commonly used flowchart symbols are illustrated in
Table 2.2.
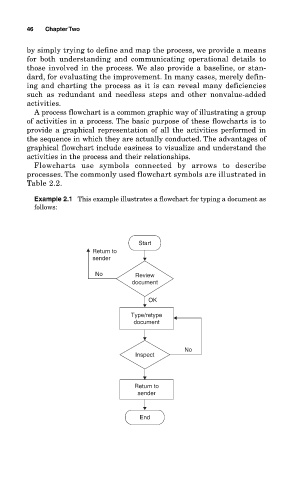
Example 2.1 This example illustrates a flowchart for typing a document as
follows:
Start
Return to
sender
No Review
document
OK
Type/retype
document
No
Inspect
Return to
sender
End