
Page 72 - Design for Six Sigma a Roadmap for Product Development
P. 72
Six Sigma and Lean Fundamentals 49
draw a value stream map, do not use a computer; just bring a writing
board, a good piece of paper, and a stopwatch. The best way is to work
backward, that is, from the last step of the process to the first step of
the process. In a production process, the last step is usually the ship-
ping dock; in a restaurant kitchen process, the last step is at the point
where the meal is done and the waitperson is picking it up to take to
the customer. In a production process, the first step is usually the
receiving deck for the incoming materials; in a restaurant kitchen
process, the first step is usually the point where the customer order is
brought into the kitchen.
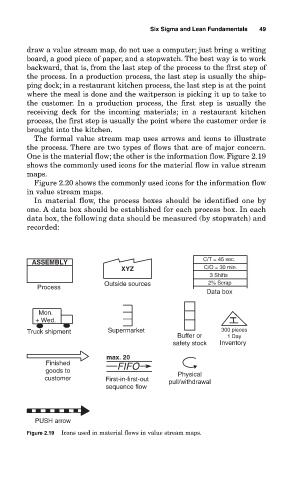
The formal value stream map uses arrows and icons to illustrate
the process. There are two types of flows that are of major concern.
One is the material flow; the other is the information flow. Figure 2.19
shows the commonly used icons for the material flow in value stream
maps.
Figure 2.20 shows the commonly used icons for the information flow
in value stream maps.
In material flow, the process boxes should be identified one by
one. A data box should be established for each process box. In each
data box, the following data should be measured (by stopwatch) and
recorded:
C/T = 45 sec.
ASSEMBLY
XYZ C/O = 30 min.
3 Shifts
Outside sources 2% Scrap
Process
Data box
Mon.
+ Wed.
Truck shipment Supermarket 300 pieces
Buffer or 1 Day
safety stock Inventory
max. 20
Finished FIFO
goods to Physical
customer First-in-first-out pull/withdrawal
sequence flow
PUSH arrow
Figure 2.19 Icons used in material flows in value stream maps.