
Page 71 - Design for Six Sigma a Roadmap for Product Development
P. 71
48 Chapter Two
2.6.2 Value stream mapping
A value stream map is another graphical tool to describe a process.
Compared with a regular process map, a value stream map can pro-
vide the following additional pieces of information:
1. Simultaneous display of several flows of jobs (material) and flow of
information
2. Analysis of process flows with lean operation principles
3. Display of lean operation metrics
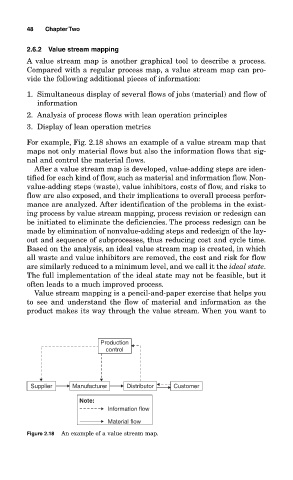
For example, Fig. 2.18 shows an example of a value stream map that
maps not only material flows but also the information flows that sig-
nal and control the material flows.
After a value stream map is developed, value-adding steps are iden-
tified for each kind of flow, such as material and information flow. Non-
value-adding steps (waste), value inhibitors, costs of flow, and risks to
flow are also exposed, and their implications to overall process perfor-
mance are analyzed. After identification of the problems in the exist-
ing process by value stream mapping, process revision or redesign can
be initiated to eliminate the deficiencies. The process redesign can be
made by elimination of nonvalue-adding steps and redesign of the lay-
out and sequence of subprocesses, thus reducing cost and cycle time.
Based on the analysis, an ideal value stream map is created, in which
all waste and value inhibitors are removed, the cost and risk for flow
are similarly reduced to a minimum level, and we call it the ideal state.
The full implementation of the ideal state may not be feasible, but it
often leads to a much improved process.
Value stream mapping is a pencil-and-paper exercise that helps you
to see and understand the flow of material and information as the
product makes its way through the value stream. When you want to
Production
control
Supplier Manufacturer Distributor Customer
Note:
Information flow
Material flow
Figure 2.18 An example of a value stream map.