
Page 133 - Design for Six Sigma for Service (Six SIGMA Operational Methods)
P. 133
108 Chapter Six
and the Whats in the rows. The relationship in every (What, How) cell
can be displayed by placing a symbol representing the cause-and-effect
relationship strength in that cell. When employees at the Kobe Shipyards
developed this matrix in 1972, they put the local horse racing symbols into
their QFD as relationship matrix symbols; for example, double-centered
circles mean a strong relationship, one circle means a medium strength rela-
tionship, and the triangle indicates a weak relationship. Symbols are used
instead of direct numbers because they can be identified and interpreted
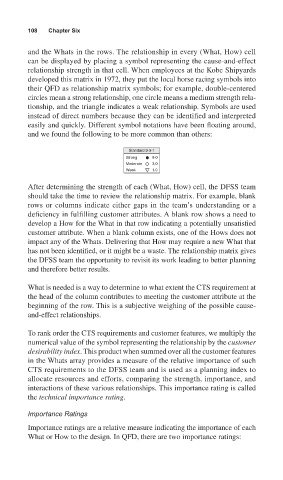
easily and quickly. Different symbol notations have been floating around,
and we found the following to be more common than others:
Standard 9-3-1
Strong 9.0
Moderate 3.0
Weak 1.0
After determining the strength of each (What, How) cell, the DFSS team
should take the time to review the relationship matrix. For example, blank
rows or columns indicate either gaps in the team’s understanding or a
deficiency in fulfilling customer attributes. A blank row shows a need to
develop a How for the What in that row indicating a potentially unsatisfied
customer attribute. When a blank column exists, one of the Hows does not
impact any of the Whats. Delivering that How may require a new What that
has not been identified, or it might be a waste. The relationship matrix gives
the DFSS team the opportunity to revisit its work leading to better planning
and therefore better results.
What is needed is a way to determine to what extent the CTS requirement at
the head of the column contributes to meeting the customer attribute at the
beginning of the row. This is a subjective weighing of the possible cause-
and-effect relationships.
To rank order the CTS requirements and customer features, we multiply the
numerical value of the symbol representing the relationship by the customer
desirability index. This product when summed over all the customer features
in the Whats array provides a measure of the relative importance of such
CTS requirements to the DFSS team and is used as a planning index to
allocate resources and efforts, comparing the strength, importance, and
interactions of these various relationships. This importance rating is called
the technical importance rating.
Importance Ratings
Importance ratings are a relative measure indicating the importance of each
What or How to the design. In QFD, there are two importance ratings: