
Page 272 - Design for Six Sigma for Service (Six SIGMA Operational Methods)
P. 272
Theory of Inventive Problem Solving (TRIZ) 241
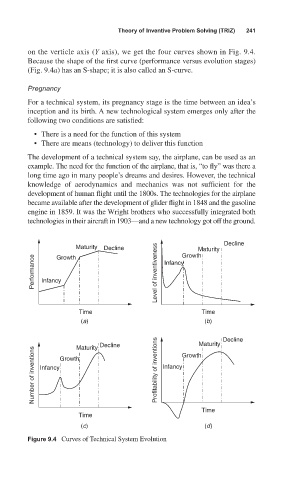
on the verticle axis (Y axis), we get the four curves shown in Fig. 9.4.
Because the shape of the first curve (performance versus evolution stages)
(Fig. 9.4a) has an S-shape; it is also called an S-curve.
Pregnancy
For a technical system, its pregnancy stage is the time between an idea’s
inception and its birth. A new technological system emerges only after the
following two conditions are satisfied:
• There is a need for the function of this system
• There are means (technology) to deliver this function
The development of a technical system say, the airplane, can be used as an
example. The need for the function of the airplane, that is, “to fly” was there a
long time ago in many people’s dreams and desires. However, the technical
knowledge of aerodynamics and mechanics was not sufficient for the
development of human flight until the 1800s. The technologies for the airplane
became available after the development of glider flight in 1848 and the gasoline
engine in 1859. It was the Wright brothers who successfully integrated both
technologies in their aircraft in 1903—and a new technology got off the ground.
Maturity Decline Growth Maturity Decline
Performance Infancy Level of inventiveness Infancy
Growth
Time Time
(a) Decline Maturity Decline
(b)
Maturity
Number of inventions Infancy Growth Profitability of inventions Infancy Growth
Time
Time
(c) (d)
Figure 9.4 Curves of Technical System Evolution