
Page 271 - Design for Six Sigma for Service (Six SIGMA Operational Methods)
P. 271
240 Chapter Nine
but to perform function F , it must have property –P, or the opposite of P.
2
For example, an automobile has to be light in weight (P) to have high fuel
economy (F ), but it also has to be heavy in weight (–P) in order to be stable
1
in driving (F ).
2
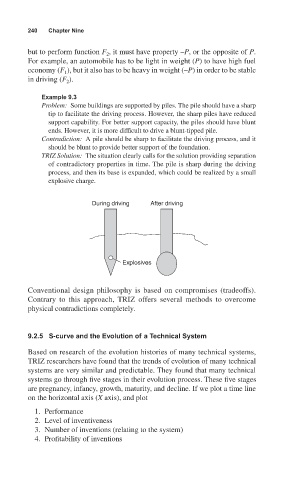
Example 9.3
Problem: Some buildings are supported by piles. The pile should have a sharp
tip to facilitate the driving process. However, the sharp piles have reduced
support capability. For better support capacity, the piles should have blunt
ends. However, it is more difficult to drive a blunt-tipped pile.
Contradiction: A pile should be sharp to facilitate the driving process, and it
should be blunt to provide better support of the foundation.
TRIZ Solution: The situation clearly calls for the solution providing separation
of contradictory properties in time. The pile is sharp during the driving
process, and then its base is expanded, which could be realized by a small
explosive charge.
During driving After driving
Explosives
Conventional design philosophy is based on compromises (tradeoffs).
Contrary to this approach, TRIZ offers several methods to overcome
physical contradictions completely.
9.2.5 S-curve and the Evolution of a Technical System
Based on research of the evolution histories of many technical systems,
TRIZ researchers have found that the trends of evolution of many technical
systems are very similar and predictable. They found that many technical
systems go through five stages in their evolution process. These five stages
are pregnancy, infancy, growth, maturity, and decline. If we plot a time line
on the horizontal axis (X axis), and plot
1. Performance
2. Level of inventiveness
3. Number of inventions (relating to the system)
4. Profitability of inventions