
Page 245 - Design of Simple and Robust Process Plants
P. 245
6.2 Basic Theory of Reliability 231
. b <1 indicates a decreasing failure rate;
. b = 1 indicates a constant failure rate; and
. b >1 indicates an increasing failure rate
There are more distributions, for example the uniform distribution, gamma distri-
bution, and chi distribution. The most frequently used of these distributions have
been mathematically expressed.
6.2.3
Estimation of Failure Parameters
The estimation of failure parameters is an important aspect of reliability engineer-
ing. The most advanced and accurate technique is based on large sample numbers,
more than 30. The first step is to determine the type of distribution which best fits
the data. For the different distributions under evaluation, the parameters are esti-
mated to obtain an optimized fit of the data and the distribution function. How suc-
cessful is the estimate can be expressed in the confidence interval of the final result.
The distribution function is selected which best fits the data within the objected con-
fidence interval limits. When these distributions and their parameters have been
selected, the failure parameter can be derived directly from the distribution equa-
tion. The advantage of this approach is that the equations can be used as bases for
the probabilistic models in Monte Carlo simulations, which solve large reliability
problems, for example process designs numerical.
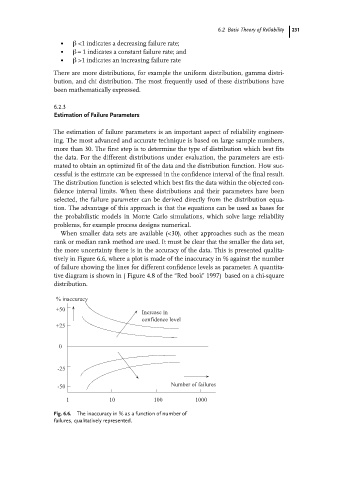
When smaller data sets are available (<30), other approaches such as the mean
rank or median rank method are used. It must be clear that the smaller the data set,
the more uncertainty there is in the accuracy of the data. This is presented qualita-
tively in Figure 6.6, where a plot is made of the inaccuracy in % against the number
of failure showing the lines for different confidence levels as parameter. A quantita-
tive diagram is shown in ( Figure 4.8 of the ªRed bookº 1997) based on a chi-square
distribution.
% inaccuracy
+50
Increase in
confidence level
+25
0
-25
-50 Number of failures
1 10 100 1000
Fig. 6.6. The inaccuracy in % as a function of number of
failures, qualitatively represented.