
Page 369 - Design of Simple and Robust Process Plants
P. 369
356 Chapter 9 Operation Optimization
unit of time. The performance meter is based on an accurate reconciled mass bal-
ance/heat balance over the process and convoluted with the related prices of the in-
dividual streams, and calculates the ongoing actual performance of the process. The
mass and heat balances were chosen as these are based on the conservation laws
which do not require model validation.
Mass and energy balance reconciliation techniques are extensively applied by
plant information systems (e.g., OSI Software, MDC and Vali II software), but also
can be configured within the software used for on-line optimization. Several applica-
tions of reconciliation and model validation were reported in the Vali user group
meetings of Belsim.
The performance measurement is expressed as the variable operating margin,
and does not include any capital-related term cost as interest or depreciation; neither
does it include any manpower costs and maintenance costs.
The variable operating margin M is defined as:
M= (Output-Input)per unit of time expressed in money units per unit of time (t)
M = Product revenues / t ± Feed (raw)material cost / t ± Energy cost / t
M= R [R i p i P i ± R j j j F j ± R k e k E k ± R l a l D A l ] (1)
where P = Product flows, F = Feed (raw)material flows, E = Energy flows, D A=
difference in Accumulation. P, F, E, A in unit mass/energy per unit time.
p = product prices, j = raw material prices, e = energy prices, a = material accu-
mulation price. p, j, e, a in money units per unit mass/energy, and t is time.
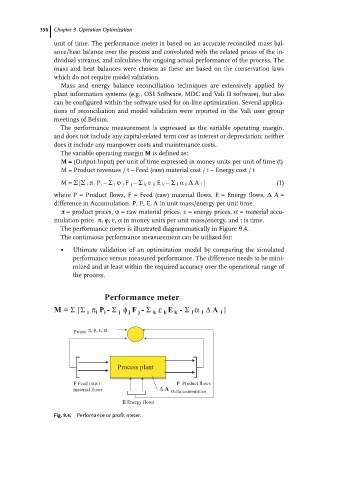
The performance meter is illustrated diagrammatically in Figure 9.4.
The continuous performance measurement can be utilized for:
. Ultimate validation of an optimization model by comparing the simulated
performance versus measured performance. The difference needs to be mini-
mized and at least within the required accuracy over the operational range of
the process.
Performance meter
M= Σ[Σ i π i P i - Σ j φ j F j - Σ k ε k E k - Σ l α l ∆ A l ]
π, φ, ε, α
Prices
Process plant
F Feed (raw) P Product flows
material flows ∆ A Delta accumulation
E Energy flows
Fig. 9.4. Perfomance or profit meter.