
Page 142 - Distillation theory
P. 142
P1: JPJ/FFX P2: FCH/FFX QC: FCH/FFX T1: FCH
0521820928c05 CB644-Petlyuk-v1 June 11, 2004 20:15
116 Distillation Trajectories and Conditions of Mixture Separability
At further increase of R (the second class of fractioning), the product point x D
moves alongside 1-2 to vertex 1, the stationary point disappears in feeding, and
the composition in the stationary point S is changed (Fig. 5.2c). At the second
2
limit (boundary) value of reflux number R , the product point x D approaches
lim
vertex 1 (the third class of fractioning; Fig. 5.2d). At this mode, the second zone
of constant concentrations (vertex 1 is the unstable node N ) appears again in
−
the column. At further increase of R (the third class of fractioning), the product
point stays in vertex 1 and the stationary point S moves to vertex 2 (Fig. 5.2e). At
R =∞, the stationary points of trajectory bundle coincide with the vertexes of
∞
concentration triangle (Fig. 5.2f) and Reg R = Reg .
w,r
It is seen from Fig. 5.2 that the distillation trajectory bundle of the one-section
R
column fills up some triangle Reg w,r , the vertexes of which are the stationary
points. Some of these stationary points are located inside the concentration tri-
angle C (3) and the rest of them outside it (i.e., they are of theoretical nature).
The triangle Reg R(3) filled up with trajectory bundle is called distillation triangle.
w,r
At a greater number of components, the trajectory bundle fills up some distil-
lation simplex Reg R(n) . In two-section columns, each section has its distillation
w,r
simplex Reg R or Reg R , and the availability of the common roots of the equa-
w,r w,s
tions of Underwood for two sections means that these simplexes in the mode of
minimum reflux adjoin to each other by their vertexes, edges, faces, or hyper-
faces.
x D
2
x
F
x B
2
R = 16.17
lim x
B
R=10.0
x
D R = 11.47
2
R=5.0 lim
D/F=0.2
1
R = 7.7
lim
(D/F) =0.26
1 x pr
R lim = 7.7 D/F=0.4 D/F=0.5 F
=0.26 D/F=0.3
(D/F) pr x B
x
2
D
R = 16.17
lim
D/F ≥ 0.26
1
2
R = 11.47 3
lim
D/F ≤ 0.2
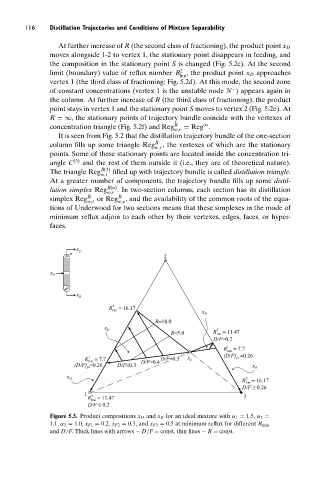
Figure 5.3. Product compositions x D and x B for an ideal mixture with α 1 = 1.5, α 2 =
1.1, α 3 = 1.0, x F1 = 0.2, x F2 = 0.3, and x F3 = 0.5 at minimum reflux for different R min
and D/F. Thick lines with arrows − D/F = const, thin lines − R = const.