Page 261 - Distillation theory
P. 261

P1: JPJ/FFX  P2: JMT/FFX  QC: FCH/FFX  T1: FCH
            0521820928c07  CB644-Petlyuk-v1                                                      June 11, 2004  20:18


                                7.3 Design Calculation of Two-Section Columns                     235

                                Table 7.1. Product concentration of non-key impurity
                                components

                                η D = η B ,     x D4 ,           x B1 ,
                                mol. fraction   mol. fraction    mol. fraction
                                0.999             6·10 –10         3·10 –6
                                0.990             5·10 –7          2·10 –4
                                0.950             1·10 –4         4.4·10 –3
                                0.900           1.2·10 –3        1.71·10 –2


                                shows the little concentrations of non-key impurity components in the products
                                x D,4 and x B,1 found for this example.
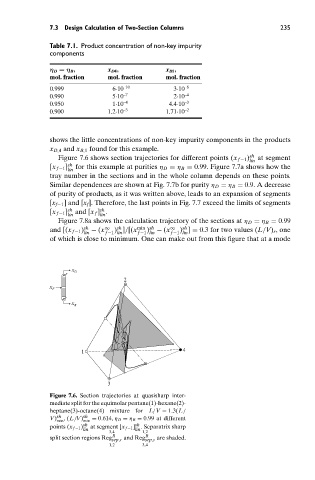
                                  Figure 7.6 shows section trajectories for different points (x f −1 ) sh  at segment
                                                                                         lin
                                [x f −1 ] sh  for this example at purities η D = η B = 0.99. Figure 7.7a shows how the
                                     lin
                                tray number in the sections and in the whole column depends on these points.
                                Similar dependences are shown at Fig. 7.7b for purity η D = η B = 0.9. A decrease
                                of purity of products, as it was written above, leads to an expansion of segments
                                [x f−1 ] and [x f ]. Therefore, the last points in Fig. 7.7 exceed the limits of segments
                                              sh
                                [x f −1 ] sh  and [x f ] .
                                     lin      lin
                                  Figure 7.8a shows the calculation trajectory of the sections at η D = η B = 0.99
                                                                      sh
                                                   sh
                                and [(x f −1 ) sh  − (x ∞  ) ]/[(x min sh  − (x ∞  ) ] = 0.3 for two values (L/V) r , one
                                                           )
                                         lin    f −1 lin  f −1 lin  f −1 lin
                                of which is close to minimum. One can make out from this figure that at a mode
                                      x D
                                                     2
                                x
                                F
                                      x B


                                         1                            4


                                                3
                                Figure 7.6. Section trajectories at quasisharp inter-
                                mediate split for the equimolar pentane(1)-hexane(2)-
                                heptane(3)-octane(4) mixture for  L/V = 1.3(L/
                                V) sh  , (L/V) sh  = 0.614,η D = η B = 0.99 at different
                                         min
                                  min
                                                        sh
                                points (x f −1 ) sh  at segment [x f −1 ] . Separatrix sharp
                                         lin            lin
                                                 3,4      1,2
                                                  R
                                split section regions Reg sep,r  and Reg R  are shaded.
                                                           sep,s
                                                 1,2      3,4
   256   257   258   259   260   261   262   263   264   265   266