Page 42 - Distillation theory
P. 42

P1: FCH
            0521820928c01  CB644-Petlyuk-v1                                                      June 11, 2004  17:45


                        16     Phase Equilibrium and Its Geometric Presentation

                                        2                    2                    2
                                a)                    b)                    c)


                                         cr                                      cr 1
                                                                                   cr 2

                               1                3   1                 3  1                 3
                                        2                     2                   2
                                d)                     e)                   f)


                                                                                  cr 1
                                         cr 2
                                      cr 1
                                        cr 3
                                                                                  cr 2
                               1                 3  1                 3  1                 3
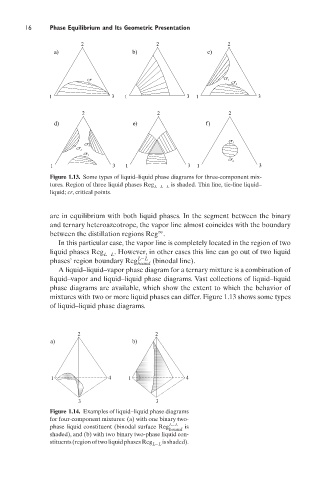
                               Figure 1.13. Some types of liquid–liquid phase diagrams for three-component mix-
                               tures. Region of three liquid phases Reg  is shaded. Thin line, tie-line liquid–
                                                             L−L−L
                               liquid; cr, critical points.


                               are in equilibrium with both liquid phases. In the segment between the binary
                               and ternary heteroazeotrope, the vapor line almost coincides with the boundary
                                                              ∞
                               between the distillation regions Reg .
                                 In this particular case, the vapor line is completely located in the region of two
                               liquid phases Reg L−L . However, in other cases this line can go out of two liquid
                                                        L−L
                               phases’ region boundary Reg bound  (binodal line).
                                 A liquid–liquid–vapor phase diagram for a ternary mixture is a combination of
                               liquid–vapor and liquid–liquid phase diagrams. Vast collections of liquid–liquid
                               phase diagrams are available, which show the extent to which the behavior of
                               mixtures with two or more liquid phases can differ. Figure 1.13 shows some types
                               of liquid–liquid phase diagrams.


                                       2                     2
                               a)                     b)


                               1                4    1                4


                                       3                     3
                               Figure 1.14. Examples of liquid–liquid phase diagrams
                               for four-component mixtures: (a) with one binary two-
                               phase liquid constituent (binodal surface Reg L−L  is
                                                                 bound
                               shaded), and (b) with two binary two-phase liquid con-
                               stituents(regionoftwoliquidphasesReg L−L isshaded).
   37   38   39   40   41   42   43   44   45   46   47