
Page 41 - Distillation theory
P. 41
P1: FCH
0521820928c01 CB644-Petlyuk-v1 June 11, 2004 17:45
1.8 Liquid–Liquid–Vapor Phase Diagrams 15
rise to regions of order of components (i.e., the quaternary azeotrope gives rise
ijk
to twelve regions of order of components Reg ord ).
Along with it, each α-surface crosses three edges of the concentration tetrahe-
dron and forms three α-points on the edges (points of intersection of α-surface
with the edges). Therefore, the quaternary azeotrope gives rise to eighteen α-
points on the concentration tetrahedron edges. The availability of these α-points
can be a sign important for practice, which allows the existence of a quaternary
azeotrope to be predicted.
In this section, we have considered the characteristics of the phase equilib-
rium coefficients field related to the phase equilibrium coefficients ratio of var-
ious components: α-points, lines, surfaces and hypersurfaces, regions of identi-
ijk
cal order of components Reg ord , and regions of reversible distillation Reg h rev, r or
Reg l rev, s .
The regions of reversible distillation and regions of the identical order of com-
ponents are especially significant for the analysis of possible cases of separation
by distillation.
As will be seen in the next chapters, the arrangement of the regions of the
boundary elements of the concentration simplex where the missing components
have the highest or lowest value of the phase equilibrium coefficients is the most
significant. To perform this task, it is enough to determine the sequence of α-points
onalledgesoftheconcentrationsimplex,aswellastheorderofcomponentswithin
the segments between these points (Petlyuk et al., 1985), just the way it is done in
Fig. 1.11.
1.8. Liquid–Liquid–Vapor Phase Diagrams
To separate mixtures in which components are characterized by a limited inter-
solubility, not only is liquid–vapor equilibrium of great importance (as it was
considered throughout the previous sections), but liquid–liquid equilibrium is also
important.
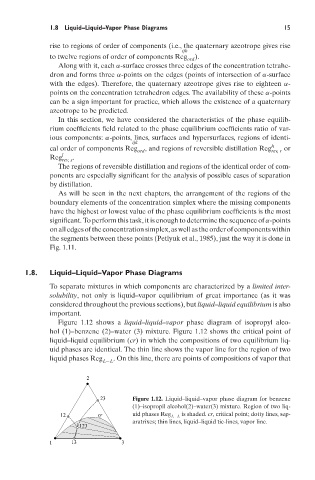
Figure 1.12 shows a liquid–liquid–vapor phase diagram of isopropyl alco-
hol (1)–benzene (2)–water (3) mixture. Figure 1.12 shows the critical point of
liquid–liquid equilibrium (cr) in which the compositions of two equilibrium liq-
uid phases are identical. The thin line shows the vapor line for the region of two
liquid phases Reg . On this line, there are points of compositions of vapor that
L−L
2
23 Figure 1.12. Liquid–liquid–vapor phase diagram for benzene
(1)–isopropil alcohol(2)–water(3) mixture. Region of two liq-
12 cr uid phases Reg L−L is shaded. cr, critical point; dotty lines, sep-
aratrixes; thin lines, liquid–liquid tie-lines, vapor line.
123
1 13 3