
Page 36 - Distillation theory
P. 36
P1: FCH
0521820928c01 CB644-Petlyuk-v1 June 11, 2004 17:45
10 Phase Equilibrium and Its Geometric Presentation
2 2 2
a) b) c)
12 24
24 12
23
23
1 4 1 123 4 1 4
34
3 3 3
2 2 2
d) e) f)
12 23
23
123 123
1 4 1 123 4 1 23 234 4
134 134 134
13 34
13
3 3 3
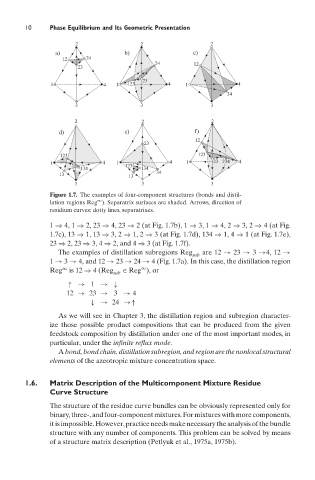
Figure 1.7. The examples of four-component structures (bonds and distil-
∞
lation regions Reg ). Separatrix surfaces are shaded. Arrows, direction of
residium curves; dotty lines, separatrixes.
1 ⇒ 4, 1 ⇒ 2, 23 ⇒ 4, 23 ⇒ 2 (at Fig. 1.7b), 1 ⇒ 3, 1 ⇒ 4, 2 ⇒ 3, 2 ⇒ 4 (at Fig.
1.7c), 13 ⇒ 1, 13 ⇒ 3, 2 ⇒ 1, 2 ⇒ 3 (at Fig. 1.7d), 134 ⇒ 1, 4 ⇒ 1 (at Fig. 1.7e),
23 ⇒ 2, 23 ⇒ 3, 4 ⇒ 2, and 4 ⇒ 3 (at Fig. 1.7f).
The examples of distillation subregions Reg are 12 → 23 → 3 →4, 12 →
sub
1 → 3 → 4, and 12 → 23 → 24 → 4 (Fig. 1.7a). In this case, the distillation region
Reg ∞ is 12 ⇒ 4 (Reg ∈ Reg ), or
∞
sub
↑→ 1 →↓
12 → 23 → 3 → 4
↓→ 24 →↑
As we will see in Chapter 3, the distillation region and subregion character-
ize those possible product compositions that can be produced from the given
feedstock composition by distillation under one of the most important modes, in
particular, under the infinite reflux mode.
A bond, bond chain, distillation subregion, and region are the nonlocal structural
elements of the azeotropic mixture concentration space.
1.6. Matrix Description of the Multicomponent Mixture Residue
Curve Structure
The structure of the residue curve bundles can be obviously represented only for
binary, three-, and four-component mixtures. For mixtures with more components,
it is impossible. However, practice needs make necessary the analysis of the bundle
structure with any number of components. This problem can be solved by means
of a structure matrix description (Petlyuk et al., 1975a, 1975b).