
Page 32 - Distillation theory
P. 32
P1: FCH
0521820928c01 CB644-Petlyuk-v1 June 11, 2004 17:45
6 Phase Equilibrium and Its Geometric Presentation
Denoting dt = dL/L, we will get the equation of a residue curve:
dx i /dt = x i − y i (i = 1, 2,... n) (1.11)
The residue curve represents the change in a mixture composition during the
open evaporation process. Each point of this line corresponds to a certain moment
of time and to a portion of evaporated liquid.
From Eq. (1.11), it results that in each point of a residue curve a liquid–vapor
tie-line is tangent to this line. The residue curves are convenient for the description
of phase equilibrium because as these lines are continuous and noncrossing.
These lines were used for the first time to describe phase behavior of
three-component azeotropic mixtures at the beginning of the twentieth century
(Ostwald, 1900; Schreinemakers, 1901). Later, the residue curves of three-
component azeotropic mixtures were studied in the works of Reinders & De
Minjer (1940a, 1940b) for the azeotropic mixture acetone–chloroform–benzene
and more widely in the works by Bushmakin & Kish (1957a, 1957b). Gurikov
(1958) developed the first classification of three-component mixtures residue
curve diagrams. In the works of Zharov (1967, 1968a, 1968b) and Serafimov
(1969) the residue curve diagrams analysis and classification were applied for four-
component and multicomponent mixtures. Several years later, these works were
summarized in a monograph by Zharov & Serafimov (1975). In recent years, other
versions of residue curve diagram classifications were developed (Matsuyama &
Nishimura, 1977; Doherty & Caldarola, 1985).
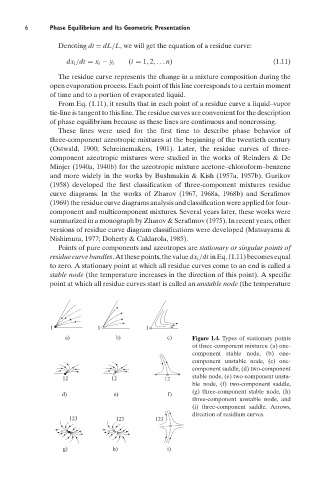
Points of pure components and azeotropes are stationary or singular points of
residuecurvebundles.Atthesepoints,thevaluedx i /dt inEq.(1.11)becomesequal
to zero. A stationary point at which all residue curves come to an end is called a
stable node (the temperature increases in the direction of this point). A specific
point at which all residue curves start is called an unstable node (the temperature
1 1 1
a) b) c) Figure 1.4. Types of stationary points
of three-component mixtures: (a) one-
component stable node, (b) one-
component unstable node, (c) one-
component saddle, (d) two-component
stable node, (e) two-component unsta-
12 12 12
ble node, (f) two-component saddle,
(g) three-component stable node, (h)
d) e) f)
three-component unstable node, and
(i) three-component saddle. Arrows,
direction of residium curves.
123 123 123
g) h) i)