Page 121 - Distributed model predictive control for plant-wide systems
P. 121

Local Cost Optimization-based Distributed Model Predictive Control      95


                                                               PC
                                            T
                                                      LC
                                                                        FC

                                   Upper Reflux
                                                                 A    Top Draw

                                          T


                               Intermediate Reflux                     Side
                                                            T
                                                                      Stripper
                                                        LC              FC
                                          T

                                                                 A    Side Draw
                                  Bottoms Reflux
                        Q(F,T)            T
                        Control
                                                             LC
                                      F    T


                                                                     Bottoms
                                 Feed

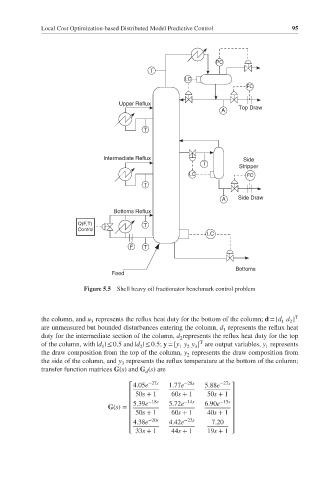
                         Figure 5.5  Shell heavy oil fractionator benchmark control problem


             the column, and u represents the reflux heat duty for the bottom of the column; d = [d d ] T
                           3                                                      1  2
             are unmeasured but bounded disturbances entering the column, d represents the reflux heat
                                                                 1
             duty for the intermediate section of the column, d represents the reflux heat duty for the top
                                                     2
                                                           T
             of the column, with |d | ≤ 0.5 and |d | ≤ 0.5; y = [y y y ] are output variables, y represents
                              1          2           1  2  3                  1
             the draw composition from the top of the column, y represents the draw composition from
                                                       2
             the side of the column, and y represents the reflux temperature at the bottom of the column;
                                    3
             transfer function matrices G(s) and G (s)are
                                           d
                                      ⎡ 4.05e −27s  1.77e −28s  5.88e −27s  ⎤
                                      ⎢ 50s + 1   60s + 1    50s + 1 ⎥
                                      ⎢     −18s      −14s      −15s  ⎥
                                       5.39e      5.72e     6.90e
                                G(s)=  ⎢                            ⎥
                                      ⎢ 50s + 1   60s + 1    40s + 1 ⎥
                                      ⎢     −20s      −22s          ⎥
                                       4.38e      4.42e       7.20
                                      ⎢                             ⎥
                                        33s + 1   44s + 1    19s + 1
                                      ⎣                             ⎦
   116   117   118   119   120   121   122   123   124   125   126