Page 260 - Distributed model predictive control for plant-wide systems
P. 260

234                           Distributed Model Predictive Control for Plant-Wide Systems


                                 0.05
                                                                Δx 1
                                   0                            Δx 2
                                                                Δx 3
                                –0.05
                                                                Δx 4
                              Δx i
                                 –0.1

                                –0.15

                                 –0.2
                                          5       10      15      20
                                                 Time (s)
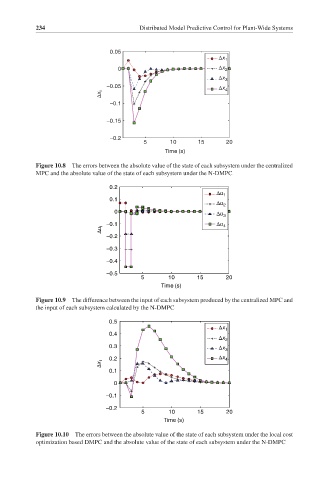
           Figure 10.8 The errors between the absolute value of the state of each subsystem under the centralized
           MPC and the absolute value of the state of each subsystem under the N-DMPC
                                 0.2
                                                               Δu 1
                                 0.1
                                                               Δu 2
                                  0
                                                               Δu 3
                                –0.1                           Δu 4
                              Δu i
                                –0.2
                                –0.3

                                –0.4
                                –0.5
                                          5       10      15      20
                                               Time (s)

           Figure 10.9 The difference between the input of each subsystem produced by the centralized MPC and
           the input of each subsystem calculated by the N-DMPC

                                0.5
                                                                Δx 1
                                0.4
                                                                Δx 2
                                0.3
                                                                Δx 3
                                0.2                             Δx 4
                              Δx i
                                0.1
                                  0

                                –0.1
                                –0.2
                                          5       10      15      20
                                                Time (s)

           Figure 10.10  The errors between the absolute value of the state of each subsystem under the local cost
           optimization based DMPC and the absolute value of the state of each subsystem under the N-DMPC
   255   256   257   258   259   260   261   262   263   264   265