
Page 261 - Distributed model predictive control for plant-wide systems
P. 261
Networked Distributed Predictive Control with Inputs and Information Structure Constraints 235
0.2
Δu 1
0
Δu 2
–0.2
Δu 3
–0.4 Δu 4
Δu i
–0.6
–0.8
–1
–1.2
5 10 15 20
Time (s)
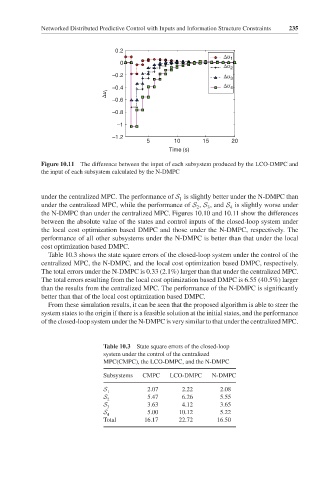
Figure 10.11 The difference between the input of each subsystem produced by the LCO-DMPC and
the input of each subsystem calculated by the N-DMPC
under the centralized MPC. The performance of S is slightly better under the N-DMPC than
1
under the centralized MPC, while the performance of S , S , and S is slightly worse under
3
4
2
the N-DMPC than under the centralized MPC. Figures 10.10 and 10.11 show the differences
between the absolute value of the states and control inputs of the closed-loop system under
the local cost optimization based DMPC and those under the N-DMPC, respectively. The
performance of all other subsystems under the N-DMPC is better than that under the local
cost optimization based DMPC.
Table 10.3 shows the state square errors of the closed-loop system under the control of the
centralized MPC, the N-DMPC, and the local cost optimization based DMPC, respectively.
The total errors under the N-DMPC is 0.33 (2.1%) larger than that under the centralized MPC.
The total errors resulting from the local cost optimization based DMPC is 6.55 (40.5%) larger
than the results from the centralized MPC. The performance of the N-DMPC is significantly
better than that of the local cost optimization based DMPC.
From these simulation results, it can be seen that the proposed algorithm is able to steer the
system states to the origin if there is a feasible solution at the initial states, and the performance
of the closed-loop system under the N-DMPC is very similar to that under the centralized MPC.
Table 10.3 State square errors of the closed-loop
system under the control of the centralized
MPC(CMPC), the LCO-DMPC, and the N-DMPC
Subsystems CMPC LCO-DMPC N-DMPC
S 2.07 2.22 2.08
1
S 5.47 6.26 5.55
2
S 3 3.63 4.12 3.65
S 4 5.00 10.12 5.22
Total 16.17 22.72 16.50