
Page 432 - Dust Explosions in the Process Industries
P. 432
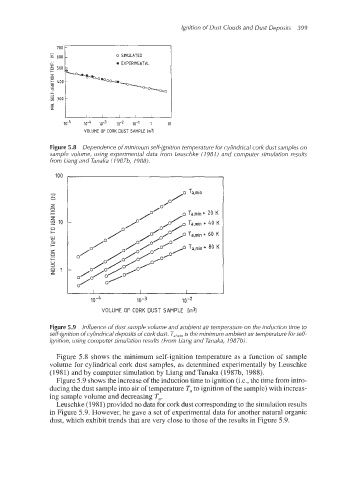
Ignition of Dust Clouds and Dust Deposits  399

                  700
                                    0 SIMULATED     I


                    lor5   10-~  10-3   10-2   10-1   1   10
                          VOLUME OF  CORK OUST SAMPLE fmq

                Figure 5.8  Dependence ofminimum self-ignition temperature for cylindrical cork dust samples on
                sampl'e volume,  using experimental  data  from Leuschke (198 1) and computer simulation  results
                from Liang and Tanaka (1987b, 1988).


                                          10-3         10-2
                               VOLUME  OF  CORK  DUST SAMPLE  [m?

                Figure 5.9  Influence of dust sample volume and ambient air temperature on the induction time to
                self-ignition of cylindrical deposits ofcork dust. Ta,mjnis the minimum ambient air temperature for self-
                ignition, using computer simulation results (From Liang and Tanaka, I987b).

                  Figure 5.8 shows the minimum self-ignition temperature as a function of  sample
                volume for cylindrical cork dust samples, as determined experimentally by Leuschke
                (1981) and by computer simulation by Liang and Tanaka (1987b, 1988).
                  Figure 5.9 shows the increaseof the induction time to ignition (i.e., the time from intro-
                ducing the dust sample into air of temperature T, to ignition of the sample) with increas-
                ing sample volume and decreasing T,.
                  Leuschke (1981) provided no data for cork dust correspondingto the simulationresults
                in Figure 5.9. However, he gave a set of experimental data for another natural organic
                dust, which exhibit trends that are very close to those of the results in Figure 5.9.