
Page 431 - Dust Explosions in the Process Industries
P. 431
398 Dust Explosions in the Process Industries
r is the radial distance in cylindrical coordinates (m);
p is the density of the sample (kg m-3);
C is the specificheat of the sample (J kg-' IC1);
13is the storage time (h);
ilis the thermal conductivity of the sample (J m-' h-' K-' 1;
Q is the heat of the reaction (J kg-l);
fis the frequency factor of chemical reaction rate (kg m-3 h-l);
E is the activation energy (J mol-l);
R is the universal gas constant (J mol-' K-l);
Tis the temperature (K).
To compare predictions by equation (5.17)with the data from Leuschke (1980,1981)
for cork dust, the appropriateboundary conditionshad to be specified, including a com-
bined heat transfer coefficient of heat dissipationby natural convection and radiation from
the cylindrical wall of the cork dust sample. Temperatureprofiles of cylindricalcork dust
samples at any time could then be calculated at various ambient temperatures by solv-
ing equation (5.17)using the finite element method. The predicted radial temperature dis-
tributions at any time, the minimum self-ignition temperature, as well as the induction
time to ignition, for various sample sizes, agreed well with the experimentaldata reported
by Leuschke (1981), except at extremely high ambient temperatures.
65C
- 600 - 550
Y -
E
w Y
4 550 3
I- k
4
E 5 450
a
5 500 r
w c-
c
45c
350
0.08 0.04 o 0.04 0.08 0.08 0.04 o 0.04 0.08 0.08 0.04 o 0.04 0.08
RADIAL DISTANCE FROM CENTER OF CYLINDRICAL CORK OUST SAMPLE Iml
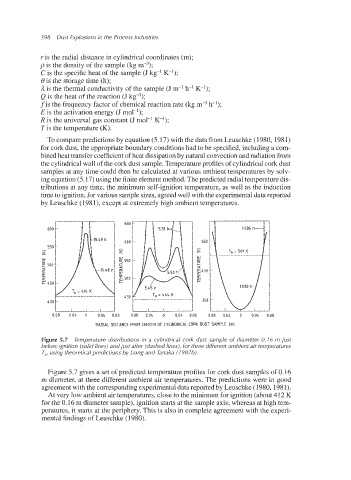
Figure 5.7 Temperature distributions in a cylindrical cork dust sample of diameter 0.16 m just
before ignition (solid lines) and just after (dashed lines), for three different ambient air temperatures
T, using theoretical predictions by Liang and Tanaka (7987b).
Figure 5.7 gives a set of predicted temperature profiles for cork dust samples of 0.16
m diameter, at three different ambient air temperatures. The predictions were in good
agreement with the corresponding experimental data reported by Leuschke (1980,1981).
At very low ambient air temperatures, close to the minimum for ignition (about 412 K
for the 0.16 m diameter sample), ignition starts at the sample axis; whereas at high tem-
peratures, it starts at the periphery. This is also in complete agreement with the experi-
mental findings of Leuschke (1980).