
Page 427 - Dust Explosions in the Process Industries
P. 427
394 Dust Explosions in the Process Industries
powedarea, represented by the expected dotted curve, much of the energy furnished to
the layer was conducted away before the reaction rate had increased significantly.
Leisch et al. (1984) also studied the propagation of smoldering combustion in layers
of wood and grain dust. The studies revealed that the smoldering combustion wave had
a definite structure and could be divided into four distinct regions. The initial part of
the wave was characterized by discoloration of the unburned material due to pyrolysis.
Pyrolysis occurred when the temperature of the unburned material reached a minimum
value characteristic of that particular material. The pyrolysis products were gaseous
volatiles and solid char. The volatiles escaped to the surroundings while the char
remained in the layer, forming the second region of the combustionwave, the combustion
zone. Oxygen from the atmosphere diffused into this zone, oxidizing the hot char,
thereby releasing heat. In the case of forced airflow over the dust layer surface,the com-
bustion zone could contain a visibly glowing subregion. The products of the combus-
tion reaction were CO, COz,H,O vapor, and solid ash. If the combustion was incomplete,
some unburned char also remained. The ash and any unburned char would then form
the third region of the combustion wave. The final region of the combustion wave was
termed the cavity. Only gases (air plus combustionproducts) were present in this region.
However, it was shown to constitute an important part of the wave structure in the
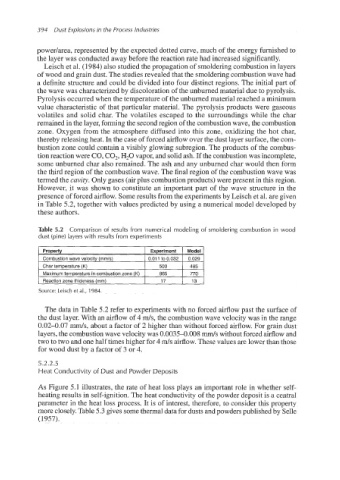
presence of forced airflow. Some results from the experimentsby Leisch et al. are given
in Table 5.2, together with values predicted by using a numerical model developed by
these authors.
Table 5.2 Comparison of results from numerical modeling of smoldering combustion in wood
dust (pine) layers with results from experiments
Property Experiment Model
Combustion wave velocity (mm/s) 0.011 to 0.032 0.029
Char temperature (K)
Maximumtemperature in combustionzone (K)
Reaction zone thickness (mm)
Source: Leisch et al., 1984.
The data in Table 5.2 refer to experiments with no forced airflow past the surface of
the dust layer. With an airflow of 4 ds, the combustion wave velocity was in the range
0.02-0.07 mds, about a factor of 2 higher than without forced airflow. For grain dust
layers, the combustion wave velocity was 0.0035-0.008 mm/s without forced airflow and
two to two and one half times higher for 4 m/s airflow. These values are lower than those
for wood dust by a factor of 3 or 4.
5.2.2.5
Heat Conductivity of Dust and Powder Deposits
As Figure 5.1 illustrates, the rate of heat loss plays an important role in whether self-
heating results in self-ignition.The heat conductivity of the powder deposit is a central
parameter in the heat loss process. It is of interest, therefore, to consider this property
more closely.Table 5.3 gives some thermal data for dusts and powders published by Selle
(1957).