
Page 483 - Dust Explosions in the Process Industries
P. 483
450 Dust Explosions in the Process Industries
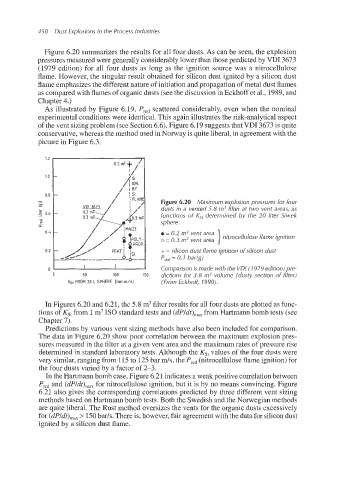
Figure 6.20 summarizes the results for all four dusts. As can be seen, the explosion
pressures measured were generally considerably lower than those predicted by VDI 3673
(1979 edition) for all four dusts as long as the ignition source was a nitrocellulose
flame. However, the singular result obtained for silicon dust ignited by a silicon dust
flame emphasizes the different nature of initiation and propagation of metal dust flames
as compared with flames of organic dusts (see the discussionin Eckhoff et al., 1989,and
Chapter 4.)
As illustrated by Figure 6.19, Predscattered considerably, even when the nominal
experimental conditions were identical. This again illustrates the risk-analytical aspect
of the vent sizing problem (see Section 6.6). Figure 6.19 suggeststhat VDI 3673 is quite
conservative, whereas the method used in Norway is quite liberal, in agreementwith the
picture in Figure 6.3.
Figure 6.20 Maximum explosion pressures for four
dusts in a vented 5.8 m3 filter at two vent areas, as
functions of K,, determined by the 20 liter Siwek
sphere:
0 = 0.2 m2 vent area
o = 0.3 m2 vent area nitrocellulose flame ignition
+ = silicon dust flame ignition of silicon dust
P,,,, = 0. I bar(g)
0 Comparison is made with the VDI (I 979 edition) pre-
0 50 100 150 dictions for 3.8 m3 volume (dusty section of filter)
Kst FROM 20 L SPHERE [bar.rn/sl (From Eckhoft 1990).
In Figures 6.20 and 6.21, the 5.8 m3filter results for all four dusts are plotted as func-
tions of Ks, from 1 m3IS0 standard tests and (dP/dt),, from Hartmann bomb tests (see
Chapter 7).
Predictions by various vent sizing methods have also been included for comparison.
The data in Figure 6.20 show poor correlation between the maximum explosion pres-
sures measured in the filter at a given vent area and the maximum rates of pressure rise
determined in standard laboratory tests. Although the K,, values of the four dusts were
very similar, ranging from 115to 125bar m/s, the Pred(nitrocelluloseflame ignition) for
the four dusts varied by a factor of 2-3.
In the Hartmann bomb case, Figure 6.21 indicates a weak positive correlationbetween
Predand (dPldt),, for nitrocellulose ignition, but it is by no means convincing. Figure
6.21 also gives the corresponding correlations predicted by three different vent sizing
methods based on Hartmann bomb tests. Both the Swedish and the Norwegian methods
are quite liberal. The Rust method oversizes the vents for the organic dusts excessively
for (dPldt),, > 150bar/s. There is, however, fair agreement with the data for silicon dust
ignited by a silicon dust flame.