
Page 541 - Dust Explosions in the Process Industries
P. 541
508 Dust Explosions in the Process Industries
10-1 100
0100 ‘OQ
090
t * A 0 = IGNITION WITH PROBABILITY
[%I AS SPECIFIED
I A A A z IGNITION PROBABILITY ZERO
2.10-4 1 I I I
10-4 10-~ 10-2
SPARK OISCHARGE TIME [SI
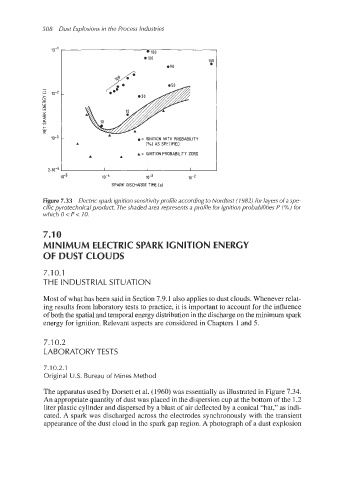
Figure 7.33 Electric spark ignition sensitivity profile according to Nordtest (1982) for layers of a spe-
cific pyrotechnical product. The shaded area represents a profile for ignition probabilities P (%) for
which 0 < P < IO.
7.10
MINIMUM ELECTRIC SPARK IGNITION ENERGY
OF DUST CLOUDS
7.1 0.1
THE INDUSTRIAL SITUATION
Most of what has been said in Section 7.9.1 also applies to dust clouds. Whenever relat-
ing results from laboratory tests to practice, it is important to account for the influence
of both the spatial and temporal energy distribution in the discharge on the minimum spark
energy for ignition. Relevant aspects are considered in Chapters 1 and 5.
7.10.2
LABORATORY TESTS
7.10.2.1
Original U.S. Bureau of Mines Method
The apparatus used by Dorsett et al. (1960) was essentially as illustratedin Figure 7.34.
An appropriatequantity of dust was placed in the dispersion cup at the bottom of the 1.2
liter plastic cylinder and dispersed by a blast of air deflected by a conical “hat,” as indi-
cated. A spark was discharged across the electrodes synchronously with the transient
appearance of the dust cloud in the spark gap region. A photograph of a dust explosion