
Page 561 - Dust Explosions in the Process Industries
P. 561
528 Dust Explosions in the Process Industries
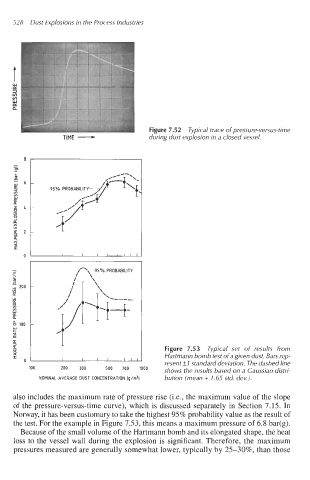
TIME - Figure 7.52 Typical trace of pressure-versus-time
during dust explosion in a closed vessel.
-
VI
1
: -
a
200
v,
n
W
n
3
VI
VI
W
a
a
100 .
W +
a
n
Figure 7.53 Typical set of results from
Hartmann bomb test of a given dust. Bars reo-
resent * 1 standard deviagon. The dashed IiAe
100 200 300
700 'Oo0 shows the results based on a Gaussian distri-
NOMINAL AVERAGE OUST CONCENTRATION [g/m31 bution (mean + 1.65 std. dev.).
also includes the maximum rate of pressure rise (i.e., the maximum value of the slope
of the pressure-versus-time curve), which is discussed separately in Section 7.15. In
Norway, it has been customary to take the highest 95% probability value as the result of
the test. For the example in Figure 7.53, this means a maximum pressure of 6.8 bar(g).
Because of the small volume of the Hartmann bomb and its elongated shape, the heat
loss to the vessel wall during the explosion is significant. Therefore, the maximum
pressures measured are generally somewhat lower, typically by 25-30%, than those