
Page 61 - Dust Explosions in the Process Industries
P. 61
34 Dust Explosions in the Process Industries
PRlMARY PARTICLE AGGLOMERATE BEHAVING
PERFECT DISPERSION POOR DISPERSION
EFFECTIVE SPECIFIC EFFECTIVE SPECIFIC
SURFACE AREA LARGE SURFACE AREA SMALL
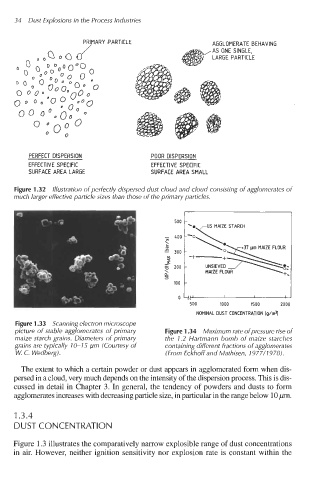
Figure 1.32 Illustration of perfectly dispersed dust cloud and cloud consisting of agglomerates of
much larger effective particle sizes than those of the primary particles.
500
US MAIZE STARCH
- 400
2
E 300 -t -
UNSIEVED
+.
0 4t1 I I I
500 1000 1500 2000
NOMINAL DUST CONCENTRATION lg/m?
Figure 1.33 Scanning electron microscope
picture of stable agglomerates of primary Figure 1.34 Maximum rate of pressure rise of
maize starch grains. Diameters of primary the 1.2 Hartmann bomb of maize starches
grains are typically 7 0- 15 pm (Courtesy of containing different fractions of agglomerates
W. C. Wedberg). (From Eckhoff and Mathisen, 1977/1978).
The extent to which a certain powder or dust appears in agglomerated form when dis-
persed in a cloud, very much depends on the intensity of the dispersion process. This is dis-
cussed in detail in Chapter 3. In general, the tendency of powders and dusts to form
agglomerates increases with decreasing particle size, in particular in the range below 10 pm.
1.3.4
DUST CONCENTRATION
Figure 1.3 illustrates the comparatively narrow explosible range of dust concentrations
in air. However, neither ignition sensitivity nor explosion rate is constant within the