
Page 62 - Dust Explosions in the Process Industries
P. 62
Dust Explosions: An Overview 35
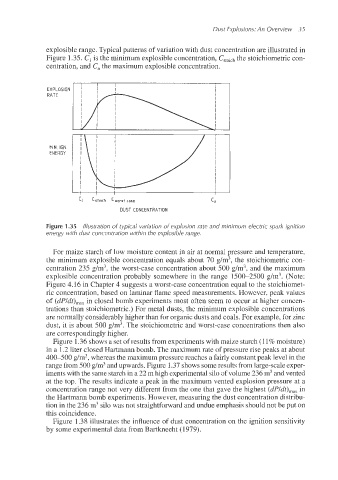
explosible range. Typical patterns of variation with dust concentration are illustrated in
Fi,gure 1.35. C1is the minimum explosible concentration, Cstoichthe stoichiometric con-
centration, and C, the maximum explosible concentration.
'1 Cstoich Cworst case
DUST CONCENTRATION
Figure 1.35 Illustration of typical variation of explosion rate and minimum electric spark ignition
energy with dust concentration within the explosible range.
For maize starch of low moisture content in air at normal pressure and temperature,
the minimum explosible concentration equals about 70 gJm3, the stoichiometric con-
centration 235 g1m3,the worst-case concentration about 500 g/m3, and the maximum
explosible concentration probably somewhere in the range 1500-2500 g/m3. (Note:
Figure 4.16 in Clhapter 4 suggests a worst-case concentration equal to the stoichiomet-
ric concentration, based on laminar flame speed measurements. However, peak values
of (dpldt),,, in closed bomb experiments most often seem to occur at higher concen-
traltions than stoichiometric.) For metal dusts, the minimum explosible concentrations
are normally considerably higher than for organic dusts and coals. For example, for zinc
dust, it is about 500 g/m'. The stoichiometric and worst-case concentrations then also
are correspondingly higher.
Figure 1.36 shows a set of results from experiments with maize starch (11% moisture)
in a 1.2 liter closed Hartmann bomb. The maximum rate of pressure rise peaks at about
400-500 g/m3,whereas the maximum pressure reaches a fairly constant peak level in the
range from 500 g/m3and upwards. Figure 1.37 shows some results from large-scale exper-
iments with the same starch in a 22 m high experimental silo of volume 236 m3and vented
at the top. The results indicate a peak in the maximum vented explosion pressure at a
concentration range not very different from the one that gave the highest (dP/dt)maxin
the Hartmann bomb experiments. However, measuring the dust concentration distribu-
tion in the 236 m3silo was not straightforward and undue emphasis should not be put on
this coincidence.
Figure 1.38 illustrates the influence of dust concentration on the ignition sensitivity
by some experimental data from Bartknecht (1979).