
Page 73 - Dust Explosions in the Process Industries
P. 73
46 Dust Explosions in the Process Industries
lines at 1000°C and 0.088 mJ is indicated. This means that the ME values for organic
dusts at elevated temperatures can be estimated by linear interpolation between this
common point and the measured MIE value at the ambient temperature.
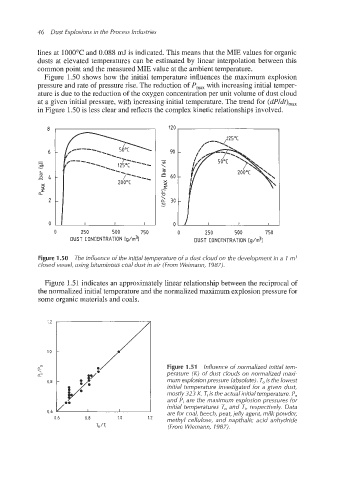
Figure 1.50 shows how the initial temperature influences the maximum explosion
pressure and rate of pressure rise. The reduction of P,,, with increasing initial temper-
ature is due to the reduction of the oxygen concentration per unit volume of dust cloud
at a given initial pressure, with increasing initial temperature. The trend for (dpldt),,
in Figure 1.50 is less clear and reflects the complex kinetic relationships involved.
120
0 250 500 750 0 250 500 750
DUST CONCENTRATION [g/m31 DUST CONCENTRATION [g/rn?
Figure 1.50 The influence of the initial temperature of a dust cloud on the development in a 7 m3
closed vessel, using bituminous coal dust in air (From Weimann, 1987).
Figure 1.51 indicates an approximately linear relationship between the reciprocal of
the normalized initial temperature and the normalized maximum explosion pressure for
some organic materials and coals.
/
1.2
1.0
0 :/ Figure 1.51 Influence of normalized initial tem-
a
\ perature (K) of dust clouds on normalized maxi-
h
0.8 mum explosionpressure (absolute).Tois the lowest
initial temperature investigated for a given dust,
mostly 323 K. Tjis the actual initial temperature.Po
and Pi are the maximum explosion pressures for
initial temperatures To and Tj, respectively. Data
0.6 are for coal, beech, peat, jelly agent, milk powder,
0.6 0.8 1.0 '.2 methyl cellulose, and napthalic acid anhydride
To /Ti (From Wiemann, 7 987).