
Page 74 - Dust Explosions in the Process Industries
P. 74
Dust Explosions:An Overview 47
1.3.8
INITIAL PRESSURE OF A DUST CLOUD
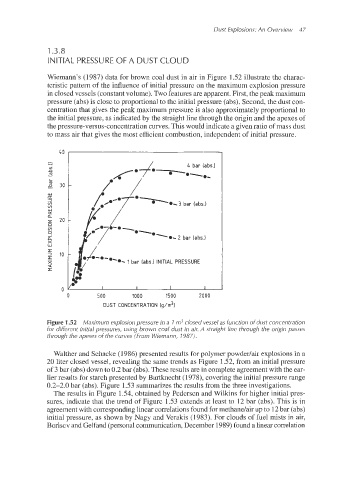
Wiemann’s (1987) data for brown coal dust in air in Figure 1.52 illustrate the charac-
teristic pattern of the influence of initial pressure on the maximum explosion pressure
in closed vessels (constant volume). Two features are apparent. First, the peak maximum
pressure (abs) is close to proportional to the initial pressure (abs). Second, the dust con-
centration that gives the peak maximum pressure is also approximately proportional to
the initial pressure, as indicated by the straight line through the origin and the apexes of
the pressure-versus-concentrationcurves.This would indicate a given ratio of mass dust
to mass air that gives the most efficient combustion, independent of initial pressure.
40
4 bar (abs.)
30
2
‘-@\Ibar (abs.)
0..
@-@-e- 1 bar (abs.) INITIAL PRESSURE
0 500 1000 1500 2000
DUST CONCENTRATION [ g/rn31
Figure 1.52 Maximum explosion pressure in a 1 m3 closed vessel as function of dust concentration
for different initial pressures, using brown coal dust in air. A straight line through the origin passes
through the apexes of the curves (From Wiemann, 1987).
Walther and Schacke (1986) presented results for polymer powdedair explosions in a
20 liter closed vessel, revealing the same trends as Figure 1.52, from an initial pressure
of 3 bar (abs) down to 0.2 bar (abs). These results are in completeagreementwith the ear-
lier results for starch presented by Bartknecht (1978), covering the initial pressure range
0.2-2.0 bar (abs). Figure 1.53 summarizes the results from the three investigations.
The results in Figure 1.54, obtained by Pedersen and Wilkins for higher initial pres-
sures, indicate that the trend of Figure 1.53 extends at least to 12 bar (abs). This is in
agreement with correspondinglinear correlationsfound for methane/airup to 12bar (abs)
initial pressure, as shown by Nagy and Verakis (1983). For clouds of fuel mists in air,
Borisoiv and Gelfand (personalcommunication,December 1989)found a linear correlation