
Page 76 - Dust Explosions in the Process Industries
P. 76
Dust Explosions: An Overview 49
between initial pressure and maximum explosion pressure up to very high initial pres-
sures, approaching 100 bar.
Figure 1.54 also gives the maximum rate of pressure rise as a function of initial pres-
sure. The excellent linear correlation is the result of somewhat arbitrary adjustment of
the dust dispersion conditions with increasing quantities of dust to be dispersed.
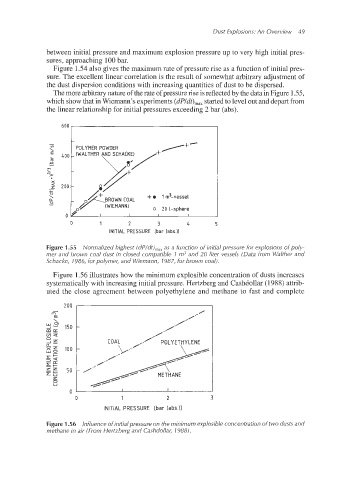
The more arbitrarynature of the rate of pressurerise is reflectedby the data in Figure 1.55,
which show that in Wiemann's experiments (dPldt),, started to level out and depart from
the linear relationship for initial pressures exceeding 2 bar (abs).
600
- - - -
POWDER
POLYMER
VI
VI
\
\ POLYMER POWDER
E - (WALTHER AND SCHACKEI
- (WALTHER AND SCHACKEI
400
E 400
m
n
m - -
X
200
9 200 - -
+
U
+o I mivessel
OWN COAL
\ OWN COAL +o I mivessel
CL - -
E
20
0 20 I-sphere
I-sphere
0
.do
0 .do I I I I I I I I
0
0 1 2 3 4 5
INITIAL PRESSURE Ibar (abs.)]
Figure 1.55 Normalized highest (dP/dt),,, as a function of initial pressure for explosions of poly-
mer and brown coal dust in closed compatible I m3 and 20 liter vessels (Data from Walther and
Schacke, 7986, for polymer, and Wiemann, 1987, for brown coal).
Figure 1.56 illustrates how the minimum explosible concentration of dusts increases
systematicallywith increasing initial pressure. Hertzberg and Cashdollar (1988) attrib-
uted the close agreement between polyethylene and methane to fast and complete
150
COAL .'"' POLYETHYLENE
I I
0 1 2 3
INITIAL PRESSURE Ibar (abs.11
Figure 1.56 Influence of initialpressure on the minimum explosible concentration of two dusts and
methane in air (From Hertzberg and Cashdollar, 1988).