
Page 155 - Dynamic Loading and Design of Structures
P. 155
Page 131
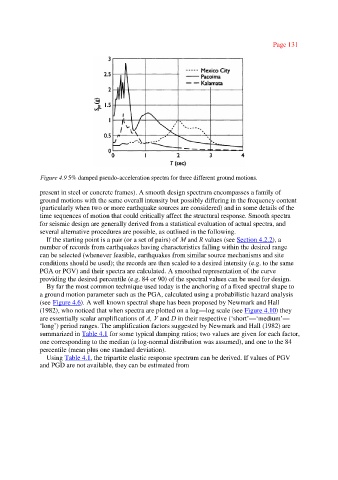
Figure 4.9 5% damped pseudo-acceleration spectra for three different ground motions.
present in steel or concrete frames). A smooth design spectrum encompasses a family of
ground motions with the same overall intensity but possibly differing in the frequency content
(particularly when two or more earthquake sources are considered) and in some details of the
time sequences of motion that could critically affect the structural response. Smooth spectra
for seismic design are generally derived from a statistical evaluation of actual spectra, and
several alternative procedures are possible, as outlined in the following.
If the starting point is a pair (or a set of pairs) of M and R values (see Section 4.2.2), a
number of records from earthquakes having characteristics falling within the desired range
can be selected (whenever feasible, earthquakes from similar source mechanisms and site
conditions should be used); the records are then scaled to a desired intensity (e.g. to the same
PGA or PGV) and their spectra are calculated. A smoothed representation of the curve
providing the desired percentile (e.g. 84 or 90) of the spectral values can be used for design.
By far the most common technique used today is the anchoring of a fixed spectral shape to
a ground motion parameter such as the PGA, calculated using a probabilistic hazard analysis
(see Figure 4.6). A well known spectral shape has been proposed by Newmark and Hall
(1982), who noticed that when spectra are plotted on a log—log scale (see Figure 4.10) they
are essentially scalar amplifications of A, V and D in their respective (‘short’—‘medium’—
‘long’) period ranges. The amplification factors suggested by Newmark and Hall (1982) are
summarized in Table 4.1 for some typical damping ratios; two values are given for each factor,
one corresponding to the median (a log-normal distribution was assumed), and one to the 84
percentile (mean plus one standard deviation).
Using Table 4.1, the tripartite elastic response spectrum can be derived. If values of PGV
and PGD are not available, they can be estimated from